. 2025 Mar 24;26(7):2948.
doi: 10.3390/ijms26072948.

Subgenomic RNA and Limited Cross-Reactive Neutralising Antibodies Point to Potential Improvements in SARS-CoV-2 Clinical Handling

Affiliations

Subgenomic RNA and Limited Cross-Reactive Neutralising Antibodies Point to Potential Improvements in SARS-CoV-2 Clinical Handling

Carlos Davina-Nunez et al. Int J Mol Sci. .

Abstract

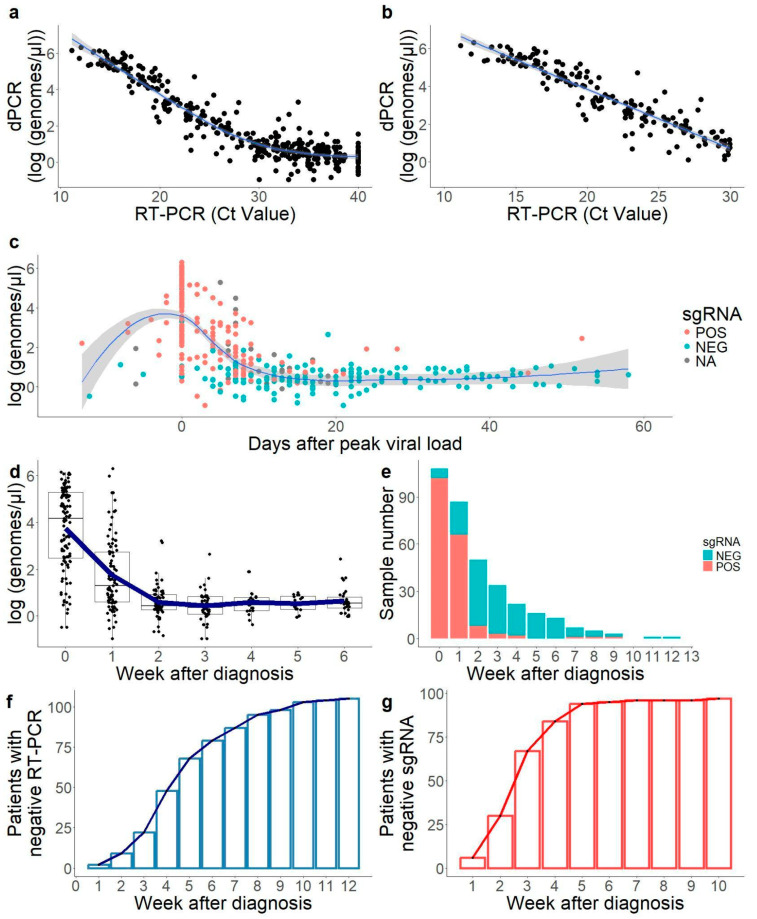
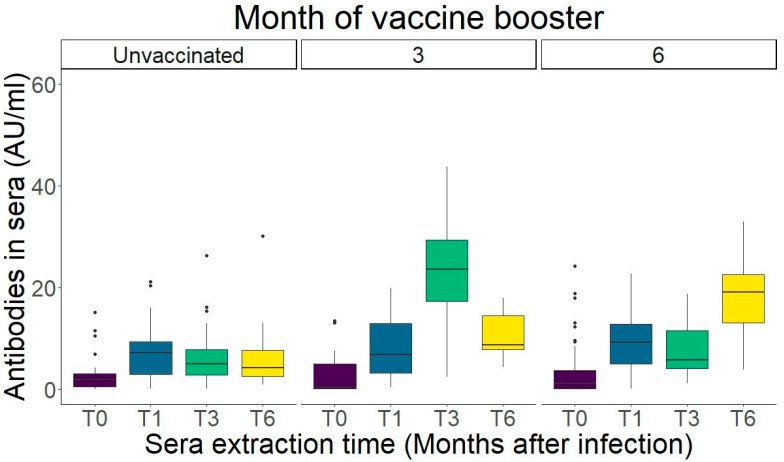
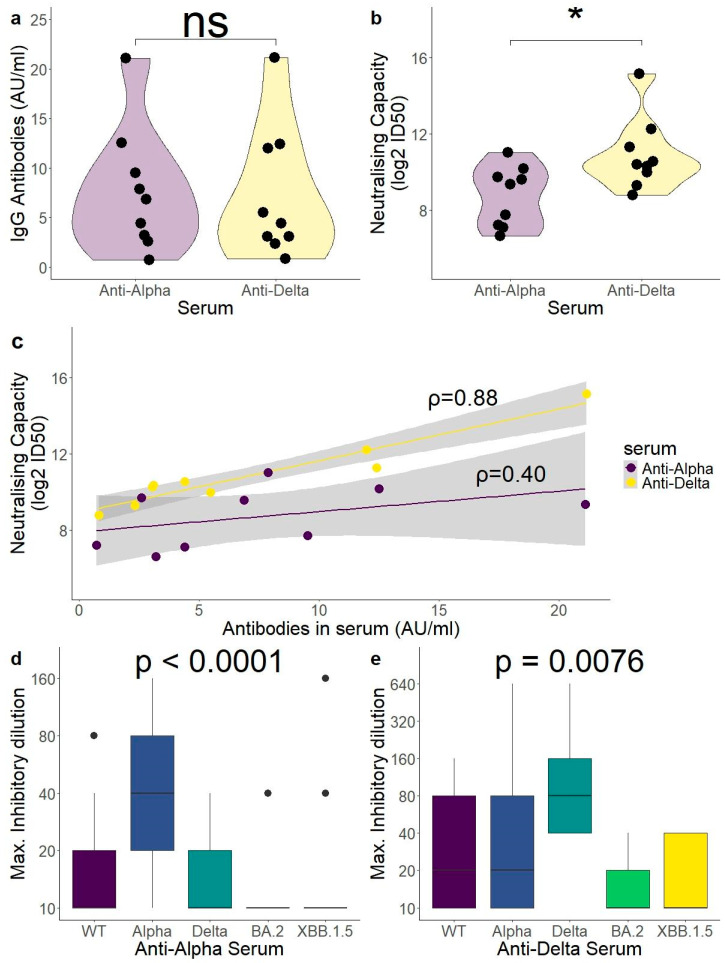
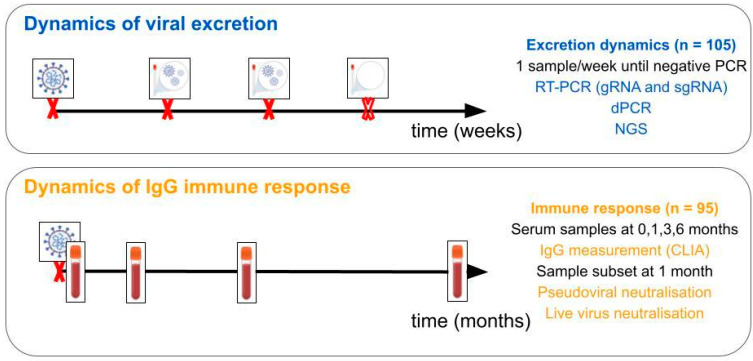
The current clinical management of SARS-CoV-2 disease control and immunity may be not optimal anymore. Reverse transcription polymerase chain reaction (RT-PCR) of genomic viral RNA is broadly used for diagnosis, even though the virus may still be detectable when it is already non-infectious. Regarding serology, commercial assays mostly still rely on ancestral spike detection despite significant changes in the genetic sequence of the current circulating variants. We followed a group of 105 non-vaccinated individuals, measuring their viral shedding until negativity and antibody response up to six months. The mean viral detection period until a negative RT-PCR result was 2.2 weeks when using subgenomic RNA-E as a detection target, and 5.2 weeks when using genomic RNA as a detection target. Our neutralising antibody results suggest that, when challenged against a variant different from the variant of first exposure, commercial immunoassays are suboptimal at predicting the neutralising capacity of sera. Additionally, anti-Alpha and anti-Delta antibodies showed very low cross-reactivity between variants. This study provides insights into viral shedding and immune response in pre-Omicron variants like Alpha and Delta, which have been understudied in the published literature. These conclusions point to potential improvements in the clinical management of SARS-CoV-2 cases in order to organise vaccination campaigns and select monoclonal antibody treatments.

Keywords: SARS-CoV-2; neutralising antibodies; subgenomic RNA; viral shedding dynamics.


Conflict of interest statement

Authors Almudena Rojas and Joaquin Mendoza are from VIRCELL S.L, the authors declare no conflict of interest. The funders had no role in the design of the study; in the collection, analyses, or interpretation of data; in the writing of the manuscript; or in the decision to publish the results.

Figures

Figure 1
Figure 1
Study of SARS-CoV-2 viral excretion dynamics. (a,b) Correlation of RT-PCR (Ct value) and dPCR (absolute quantification) in the estimation of viral load. Correlation was linear until Ct = 30, as shown on the panel on the right (Pearson correlation coefficient in samples below Ct 30: 0.87; in samples above Ct 30: 0.08). Blue lines: LOESS (panel (a)) and linear (panel (b)) approximation model. (c) Excretion dynamics from all positive samples in the study. Day 0 is marked for all subjects as the day of the PCR with the highest viral load. Blue line: LOESS approximation with grey area showing the 95% confidence interval. Point colour indicates the detection of subgenomic RNA (sgRNA) in each sample, with NA indicating samples that were not tested for sgRNA. (d) Boxplot of viral load of all samples per week after diagnosis. The blue line indicates the mean value per week. Six (6) refers to six or more weeks in this plot. (e) Amount of samples positive in gRNA that were positive in sgRNA (red) or negative (blue) per week after diagnostic. (f) Amount of patients with a negative RT-PCR in gRNA per week. (g) Amount of patients with a negative RT-PCR in sgRNA per week. All data used to generate this figure are available in Supplementary File S1.
Figure 2
Figure 2
IgG levels of patients according to vaccination time. (Left) Unvaccinated individuals. After a peak in month 1, antibody AUs decreased moderately in months 3 and 6. (Middle) Individuals vaccinated before month 3. A boost of IgG from vaccination is shown. However, at month 6, antibody levels already dropped to around pre-vaccination levels (month 1). (Right) Individuals vaccinated before month 6. Antibody boost caused by vaccination at the month 6 measurement. Dots indicate datapoints above 1.5 times the interquartile range (IQR). All data used to generate this figure are available in Supplementary File S3.
Figure 3
Figure 3
Neutralisation capacity post-infection was highest against variants of infection. (a) A total of 18 sera samples were selected for pseudovirus neutralisation, 9 from patients infected with the Alpha variant and 9 infected with the Delta variant, with paired IgG CLIA results (p = 0.73). (b) Neutralising capacity of Delta-spike carrying pseudovirus particles. Anti-Delta sera were more successful at neutralising the Delta pseudovirus than anti-Alpha sera (p = 0.024). (c) The CLIA assay was better at predicting Delta neutralisation capacity in anti-Delta than in anti-Alpha sera (p = 0.003 vs p = 0.29). (d,e) Live virus neutralisation assay showed the best neutralisation capacity for variants of infection and a significant drop in the neutralisation of Omicron variants. Minimum sera dilution tested was 1:20, with a value of 10 being indicated for samples with no neutralisation detected. For (a,b), the Wilcoxon signed-rank test. For (c), Spearman’s rank correlation coefficient. The lines represent the linear model approximation with the grey area being the 95% confidence interval. For (d,e), Kruskal–Wallis test. All data used to generate this figure are available in Supplementary File S4. ns = non significant. * = p < 0.05.
Figure 4
Figure 4
Graphical summary. For the first aim of the study, viral load was determined in one sample per participant and week until negative on three targets of an RT-PCR test. For the second, serum samples were taken at 0, 1, 3, and 6 months after infection in order to measure IgG levels and study neutralisation capacity.

Similar articles

References

    1. Tsang N.N.Y., So H.C., Ng K.Y., Cowling B.J., Leung G.M., Ip D.K.M. Diagnostic performance of different sampling approaches for SARS-CoV-2 RT-PCR testing: A systematic review and meta-analysis. Lancet Infect. Dis. 2021;21:1233–1245. doi: 10.1016/S1473-3099(21)00146-8. - DOI - PMC - PubMed
    1. Richard-Greenblatt M., Ziegler M.J., Bromberg V., Huang E., Abdallah H., Tolomeo P., Lautenbach E., Glaser L., Kell B.J. Quantifying the Impact of Nasopharyngeal Specimen Quality on Severe Acute Respiratory Syndrome Coronavirus 2 Test Performance. Open Forum Infect. Dis. 2021;8:ofab235. doi: 10.1093/ofid/ofab235. - DOI - PMC - PubMed
    1. Puhach O., Meyer B., Eckerle I. SARS-CoV-2 viral load and shedding kinetics. Nat. Rev. Microbiol. 2023;21:147–161. doi: 10.1038/s41579-022-00822-w. - DOI - PMC - PubMed
    1. Cevik M., Tate M., Lloyd O., Maraolo A.E., Schafers J., Ho A. SARS-CoV-2, SARS-CoV, and MERS-CoV viral load dynamics, duration of viral shedding, and infectiousness: A systematic review and meta-analysis. Lancet Microbe. 2021;2:e13–e22. doi: 10.1016/S2666-5247(20)30172-5. - DOI - PMC - PubMed
    1. Mishra B., Ranjan J., Purushotham P., Saha S., Payal P., Kar P., Das S., Deshmukh V. High proportion of low cyclethreshold value as an early indicator of COVID-19 surge. J. Med. Virol. 2022;94:240–245. doi: 10.1002/jmv.27307. - DOI - PMC - PubMed

MeSH terms

LinkOut - more resources