. 2025 Mar 25;26(7):2958.
doi: 10.3390/ijms26072958.

Decoding PHR-Orchestrated Stress Adaptation: A Genome-Wide Integrative Analysis of Transcriptional Regulation Under Abiotic Stress in Eucalyptus grandis

Affiliations

Decoding PHR-Orchestrated Stress Adaptation: A Genome-Wide Integrative Analysis of Transcriptional Regulation Under Abiotic Stress in Eucalyptus grandis

Huiming Xu et al. Int J Mol Sci. .

Abstract

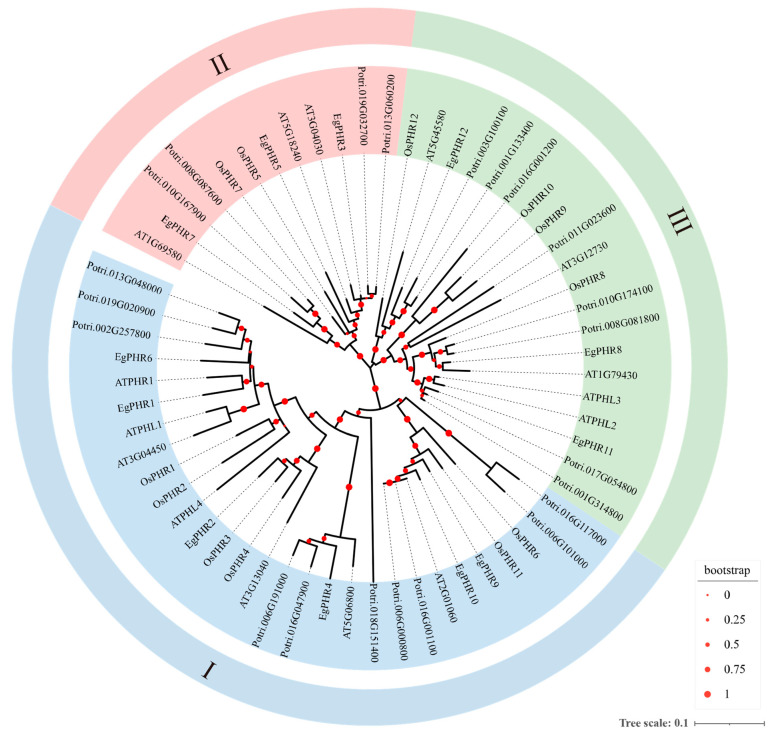
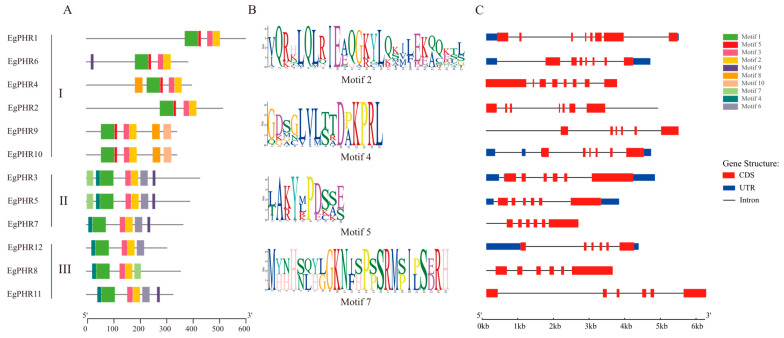
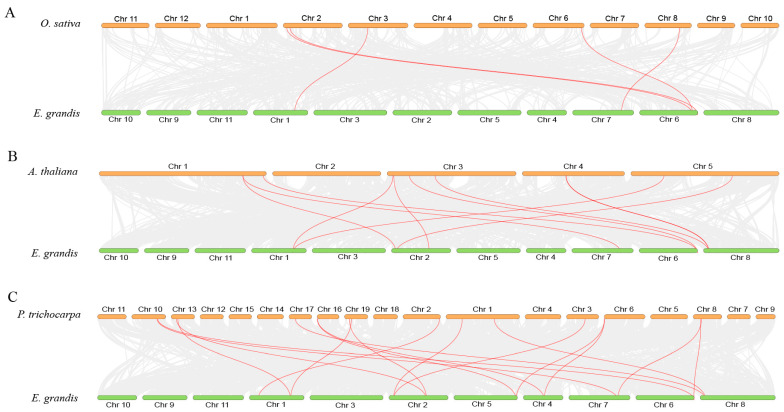
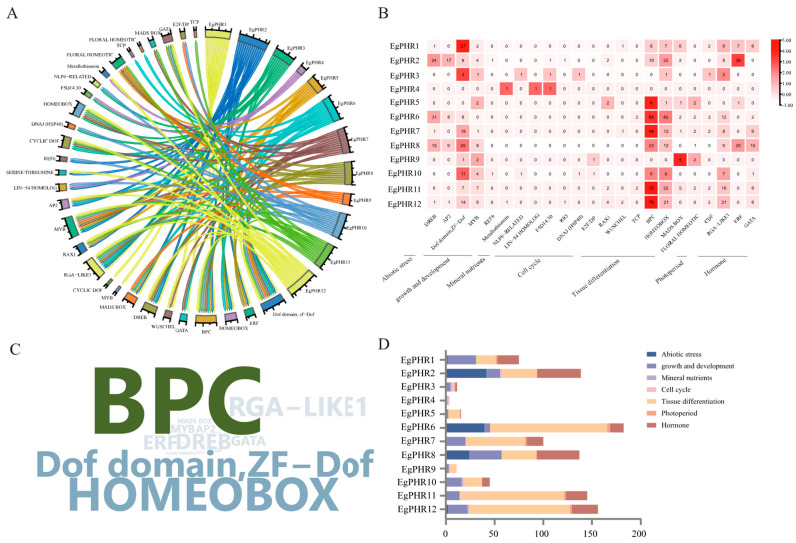
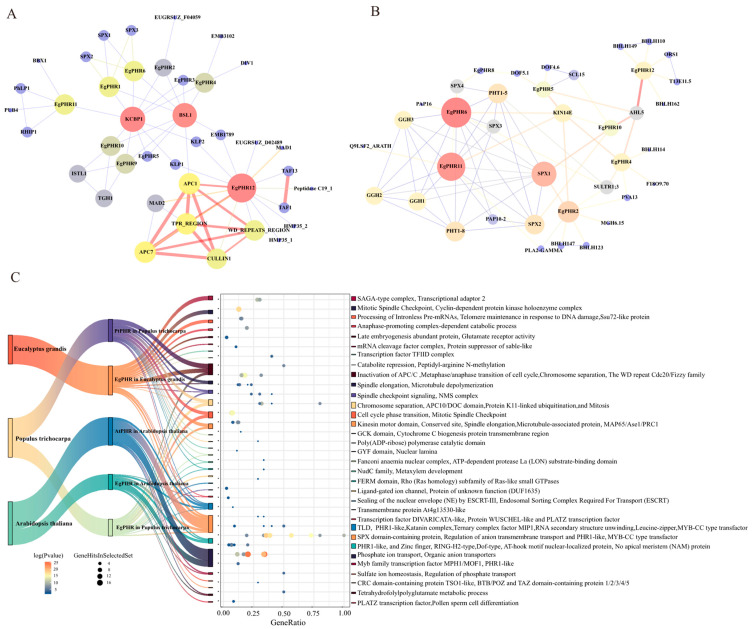
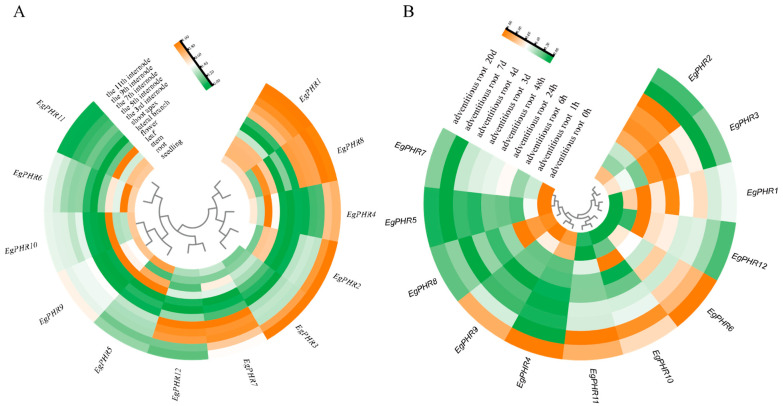
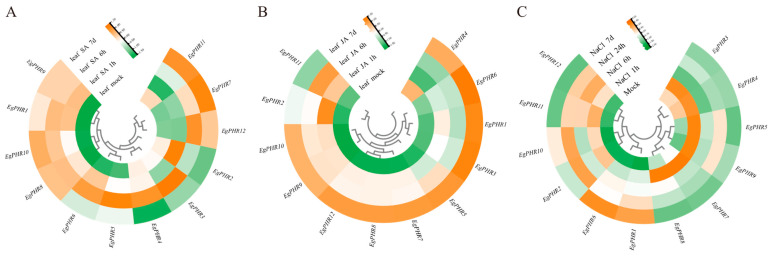
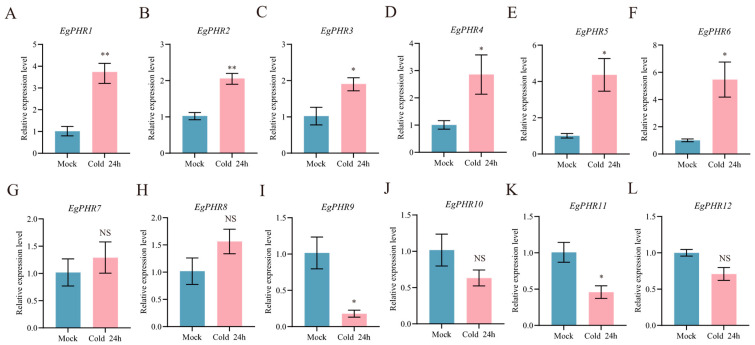
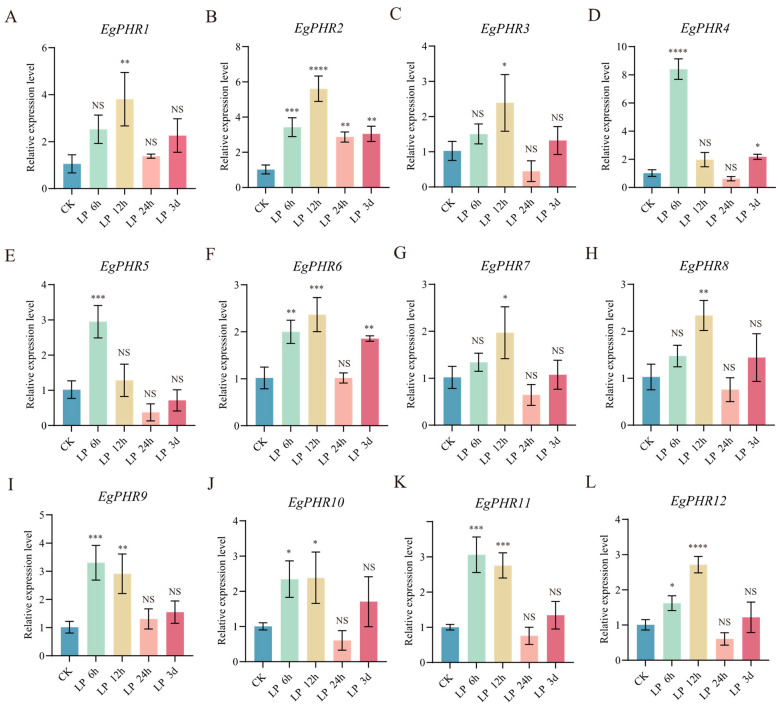
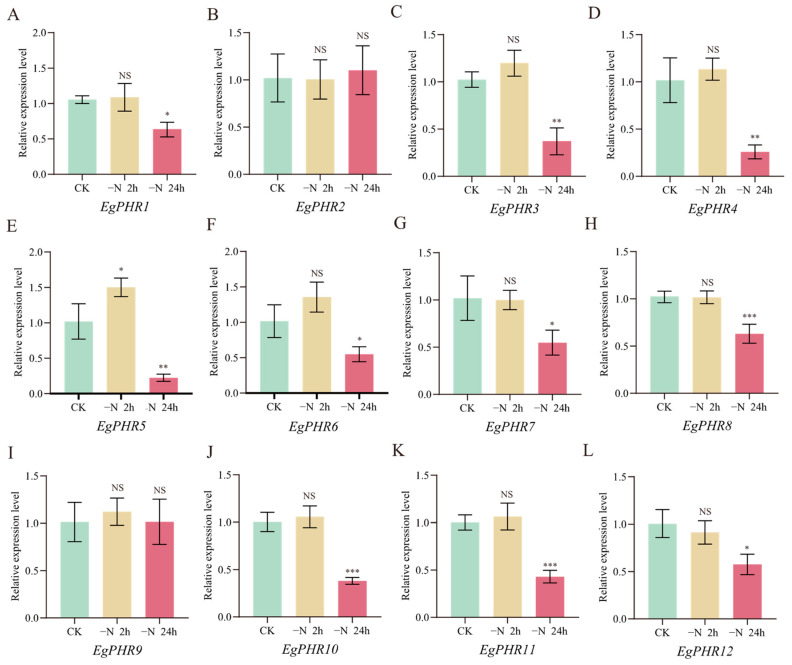
The phosphate starvation response (PHR) transcription factor family play central regulatory roles in nutrient signaling, but its relationship with other abiotic stress remains elusive. In the woody plant Eucalyptus grandis, we characterized 12 EgPHRs, which were phylogenetically divided into three groups, with group I exhibiting conserved structural features (e.g., unique motif composition and exon number). Notably, a protein-protein interaction network analysis revealed that EgPHR had a species-specific protein-protein interaction network: EgPHR6 interacted with SPX proteins of multiple species, while Eucalyptus and poplar PHR uniquely bound to TRARAC-kinesin ATPase, suggesting functional differences between woody and herbaceous plants. A promoter sequence analysis revealed a regulatory network of 59 transcription factors (TFs, e.g., BPC, MYBs, ERFs and WUS), mainly associated with tissue differentiation, abiotic stress, and hormonal responses that regulated EgPHRs' expression. Transcriptomics and RT-qPCR gene expression analyses showed that all EgPHRs dynamically responded to phosphate (Pi) starvation, with the expression of EgPHR2 and EgPHR6 exhibiting sustained induction, and were also regulated by salt, cold, jasmonic acid, and boron deficiency. Strikingly, nitrogen starvation suppressed most EgPHRs, highlighting crosstalk between nutrient signaling pathways. These findings revealed the multifaceted regulatory role of EgPHRs in adaptation to abiotic stresses and provided insights into their unique evolutionary and functional characteristics in woody plants.

Keywords: Eucalyptus grandis; PHR; boron deficiency; cold stress; gene expression; nitrogen starvation; phosphate starvation; salt stress; transcription factor.


Conflict of interest statement

The authors declare no conflicts of interest.

Figures

Figure 1
Figure 1
Phylogenetic analysis of the PHR gene family of Eucalyptus grandis with Arabidopsis thaliana, Oryza sativa, and Populus trichocarpa. Red dots indicate bootstrap values/metadata. The size of the circle corresponds to the level of bootstrap support for the branch. Circle diameters scale proportionally with bootstrap support values from 0 to 1, where larger diameters indicate stronger statistical confidence. Values exceeding 0.5 were generally considered reliable. The phylogenetic tree was constructed with MEGA7.0 using the maximum likelihood method with 1000 bootstraps. The tree uses three different colors to indicate the three evolutionary branches (IIII). The names of PHRs in Arabidopsis, Oryza sativa, Populus trichocarpa, and Eucalyptus grandis begin with “At”, “Os”, “Potri”, and “Eg”, respectively, at the beginning. The protein sequences of Arabidopsis, Oryza sativa, Populus trichocarpa, and Eucalyptus grandis PHRs are listed in Table S1.
Figure 2
Figure 2
Conserved motifs and gene structure of the Eucalyptus grandis PHRs. (A) Conserved motifs of EgPHR; (B) sequence identification of several special EgPHR motifs; (C) genetic structure of EgPHRs, including CDS, UTR, and introns. The position of the sequence motifs, the domains, and the size of the exons or UTRs are estimated by the scale at the bottom.
Figure 3
Figure 3
Analysis of covariance between Eucalyptus grandis PHRs and Oryza sativa (A), Arabidopsis thaliana (B), and Populus trichocarpa (C). Orange represents the chromosomes of Eucalyptus grandis, green represents the chromosomes of Oryza sativa, Arabidopsis thaliana, and Populus trichocarpa and the red line highlights PHR gene pairs with covariance.
Figure 4
Figure 4
Prediction of potential regulatory transcription factors in the Eucalyptus grandis PHR promoters. (A) Network chords of predicted transcription factors targeting the EgPHR genes. The direction of the arrow is from EgPHRs to the transcription factors. (B) Statistics on the type of potential regulatory transcription factors in the promoter region of each gene. (C) The word cloud and font size of the transcription factors are positively correlated with the number of corresponding transcription factors. (D) Horizontal bar graph representing the number of transcription factors.
Figure 5
Figure 5
Protein–protein interaction network analysis and interaction protein enrichment analysis of PHR proteins in Eucalyptus grandis, Populus trichocarpa, and Arabidopsis. (A) Interaction network between EgPHR proteins and other Eucalyptus grandis proteins. (B) Interaction network between EgPHR proteins and Arabidopsis proteins. A network diagram consists of nodes and edges, each representing a protein; node-to-node connections (Edges) represent the interactions between these nodes; the connection’s line color, shading, and thickness indicate the degree of interaction, and the node color shading and node size indicate the thickness of the node (red: large, blue: small; thick: large, thin: small). (C) Cluster enrichment of EgPHR-, PtrPHR-, and AtPHR-interacting proteins in Eucalyptus grandis, Populus trichocarpa, and Arabidopsis.
Figure 6
Figure 6
Gene expression analysis of EgPHRs in different Eucalyptus tissues and adventitious root development. Expression levels of EgPHRs in 12 different tissues (A) and 8 adventitious root induction states (B) in Eucalyptus. All samples were normalized using R software (v4.3.1) DEseq2 to obtain the final gene expression matrix. Heatmaps were plotted using R’s pheatmap and ggplot2 packages. The clustering is by rows, with orange representing high expression and green representing low expression.
Figure 7
Figure 7
Gene expression analysis of EgPHRs under JA, SA, and salt stress treatments. The heatmap displays the expression levels of EgPHRs following treatment with SA (A) and JA (B) hormones, in the SA and JA treatment within 1 h, 6 h, and 7 h. (C) Expression levels of EgPHRs under salt stress, in the 200 mM NaCl treatment within 0 h, 1 h, 6 h, 24 h and 7d. All samples were normalized using R software DEseq2 to obtain the final gene expression matrix. Heatmaps were plotted using R’s pheatmap and ggplot2 packages. Clustering is by rows, orange represents high expression, and green represents low expression.
Figure 8
Figure 8
Gene expression analysis of EgPHRs in response to cold stress. (AL) Expression of the EgPHRs in mock and cold treatment in the leaf. Seedlings were growth at 4 °C (cold stress) or 25 °C (control) for 24 h. t-test: “NS” represents no significance, “*” represents p < 0.05, “**” represents p < 0.01.
Figure 9
Figure 9
Gene expression analysis of EgPHRs in response to phosphate deficiency. (AL) General overview of the expression of the EgPHRs in phosphate deficiency treatment in CK, 6 h, 12 h, 24 h and 3 d in roots. Two-way ANOVA test: “NS” represents no significance, “*” represents p < 0.05, “**” represents p < 0.01, “***” represents p < 0.001, “****” p < 0.0001.
Figure 10
Figure 10
Gene expression analysis of EgPHRs in response to nitrogen starvation. (AL) General overview of the expression of the EgPHRs in CK, 2 h, and 24 h low nitrogen treatment in roots. CK: 10 mM KNO3 treatment, −N: 0 mM KNO3 treatment. One-way ANOVA test: “NS” represents no significance, “*” represents p < 0.05, “**” represents p < 0.01, “***” represents p < 0.001.

Similar articles

Cited by

References

    1. Fang X., Yang D., Deng L., Zhang Y., Lin Z., Zhou J., Chen Z., Ma X., Guo M., Lu Z., et al. Phosphorus uptake, transport, and signaling in woody and model plants. For. Res. 2024;4:e017. doi: 10.48130/forres-0024-0014. - DOI - PMC - PubMed
    1. Hong L., Wang Q., Zhang J., Chen X., Liu Y., Asiegbu F.O., Wu P., Ma X., Wang K. Advances in the beneficial endophytic fungi for the growth and health of woody plants. For. Res. 2024;4:e028. doi: 10.48130/forres-0024-0025. - DOI - PMC - PubMed
    1. Paz-Ares J., Puga M.I., Rojas-Triana M., Martinez-Hevia I., Diaz S., Poza-Carrion C., Minambres M., Leyva A. Plant adaptation to low phosphorus availability: Core signaling, crosstalks, and applied implications. Mol. Plant. 2022;15:104–124. doi: 10.1016/j.molp.2021.12.005. - DOI - PubMed
    1. Wang Y., Chen Y.F., Wu W.H. Potassium and phosphorus transport and signaling in plants. J. Integr. Plant Biol. 2021;63:34–52. doi: 10.1111/jipb.13053. - DOI - PubMed
    1. Meharg A.A. In: Marschner’s Mineral Nutrition of Higher Plants. 3rd ed. Marschner P., editor. Elsevier; Amsterdam, The Netherlands: Academic Press; Amsterdam, The Netherlands: 2011. p. 684.

LinkOut - more resources