. 2025 Mar 24;26(7):2936.
doi: 10.3390/ijms26072936.

Experimental Conditions to Retrieve Intrinsic Cooperativity α Directly from Single Binding Assay Data Exemplified by the Ternary Complex Formation of FKBP12, MAPRE1 and Macrocyclic Molecular Glues

Affiliations

Experimental Conditions to Retrieve Intrinsic Cooperativity α Directly from Single Binding Assay Data Exemplified by the Ternary Complex Formation of FKBP12, MAPRE1 and Macrocyclic Molecular Glues

Jan Schnatwinkel et al. Int J Mol Sci. .

Abstract

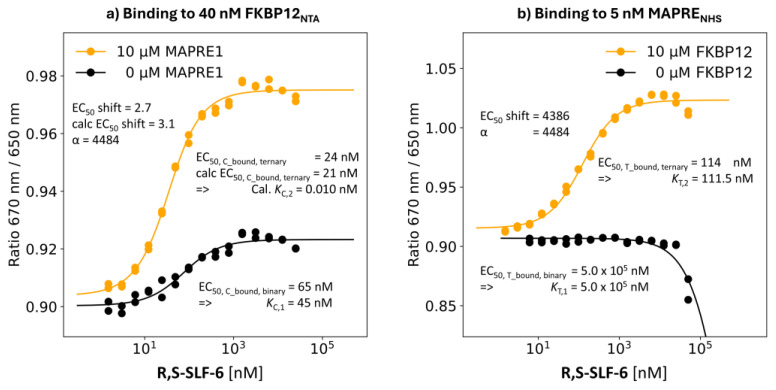
The incorporation of disease-relevant targets into ternary complexes in a compound-dependent manner by utilizing an assisting chaperone has become a common modality as far as bifunctional ternary complex-forming compounds are concerned. In contrast, examples of ternary complexes formed by molecular glues are much rarer. Due to their lack of significant binary (independent) target affinity, their identification cannot yet be achieved by rational methods and is, therefore, much more challenging. However, it is precisely for that reason (given the associated advantages) that their systematic identification and application in drug discovery has recently attracted particular interest. In contrast to bifunctional ternary complex-forming compounds, molecular glues retrieve a significant part of their thermodynamic stability through newly induced chaperone-target or glue-target interactions that occur only in the ternary complex. These interactions lead to enhanced ligand binding-termed intrinsic cooperativity α-which can be retrieved via the apparent cooperativity either by monitoring ligand binding through the chaperone or through the target protein. In this publication, the advantage of measuring the apparent cooperativity (to determine the cooperativity α) by the weaker binding protein is discussed and illustrated using the example of ternary complexes between FKBP12, MAPRE1 and macrocyclic molecular glues derived from the rapamycin binding motif for FKBP12. Furthermore, the impact of the following three parameters on the apparent cooperativity is illustrated: (1) the concentration of the monitoring protein, (2) the excess of the counter protein, and (3) the affinity of the glue to the weaker binding protein in combination with the degree of intrinsic cooperativity α. From this, experimental conditions to determine the intrinsic cooperativity α with only one binding assay and without the need for a comprehensive mathematical model covering all simultaneous events under non-saturating conditions are highlighted. However, this framework requires a binding assay capable of measuring or at least estimating very weak binary affinities. If this is not possible for experimental reasons, but binding assays for both proteins are available within a normal bandwidth and the affinity to the stronger binding protein is not too high, it is discussed how the binding curve for the weaker binding protein in the presence of an excess of the weaker binding protein can be used to overcome the missing binary Kd for the weakly binding protein.

Keywords: FKBP12; MAPRE1; cooperativity; measuring weak affinities; spectral shift method; ternary complexes.


Conflict of interest statement

Hans-Jörg Roth, Richard Stein, Marianne Fouché, Julian Wong and Michael Salcius were employed by Novartis AG, Switzerland. Jan Schnatwinkel was employed by NanoTemper Technologies GmbH, Germany. Chen Shu-Yu was employed by ETH Zürich, Switzerland. We declare that the research was conducted in the absence of any commercial or financial relationships that could be construed as a potential conflict of interest.

Figures

Figure 1
Figure 1
The formation of ternary complexes (CLT) is achieved through two different intermediate binary complexes (CL or TL). For type I molecular glues, L has a good to strong affinity to the chaperone protein C and a weak or very weak affinity to the chaperone protein T. A possible third pathway, the formation of binary chaperone–target complex followed by ligand binding (type III molecular glues) was excluded experimentally here for the presented examples [29]. The intrinsic cooperativity α describes the factor of enhanced ligand binding of L to C when L is prebound to T (or to T when L is prebound to C). There is one unique cooperativity α that describes a given three-body system. The intrinsic cooperativity is, in analogy to the Kd, a universal constant of the ternary complex and, therefore, independent of the experimental conditions. Maximizing the intrinsic cooperativity is a strong selection criterion in the drug development of molecular glues.
Figure 2
Figure 2
Saturation as a function of the chaperone concentration. For a typical molecular glue example with [Ttot] = 5 nM, KC,1 = 100 nM, KT,1 = 100,000 nM, KT,2 = 100 nM and α = 1000, EC50 values of calculated %Tbound, ternary curves approach KT,2 = 100 nM with increasing concentrations of the chaperone. The EC50 of the %Tbound ternary curve corresponds to 102.5 nM at [Ctot] = 100,000 nM. The remaining difference to KT,2 is 50% of [Ttot] because at the inflection point—under saturation conditions—50% of [Ttot] = 5 nM is complexed by CL into CLT. Another angle from which to look at saturation is the CL concentration. As the chaperone concentration increases, the concentration of free ligand L vanishes, and the entire ligand concentration is bound into CL and CLT. In this example, saturation is only reached at [Ctot] = 100,000 nM when [CL] approaches the theoretical maximum of 97.5 nM. Calculations are performed with the previously published comprehensive mathematical model [29].
Figure 3
Figure 3
The monitored protein concentration influences the EC50 value of the %Cbound, binary curve. Protein concentrations above the Kd (here KC,1 = 100 nM) cause the EC50 and Kd to deviate from each other. For [Ctot] = 500 nM, the EC50 corresponds to 350 nM (blue curve), while for [Ctot] = 5 nM, the EC50 approaches 102.5 nM but cannot be lowered. Only at a protein concentration less or equal to 200 times below the Kd, the EC50 practically coincides with KC,1 (100.25 nM vs. 100 nM). These considerations also apply to the monitoring of ternary complex formation experiments under saturation conditions when the entire ligand concentration at the inflection point is bound into CLT and CL (or TL).
Figure 4
Figure 4
The deviation of the reduced pseudo two-body equilibrium with only one pathway and the three-body equilibrium comprising two pathways depends on the concentration of the relevant protein C. With the used [Ctot] = 104 nM, the second pathway through TL becomes more relevant for lower KT,2 = KT,1/α and the pseudo two-body equilibrium (“saturation conditions”) is affected. This leads to an increase in the ratio of KT,2 and EC50 of the %Tbound, ternary curve (y-axis) as KT,2 is close to or even below the concentration of the monitoring protein [Ttot] = 5 nM depending on the cooperativity α. In a non-cooperative system (α = 1), saturation conditions are maintained down to a low KT,1 ≈ 10 nM (red curve). For higher cooperativity (α between 10 and 1000), significant differences between KT,2 and the EC50 of the %Tbound, ternary (brown, turquoise, and blue curves) are observed for KT,1 < 10,000. For α > 1000, KT,1 must exceed 100,000 nM to maintain saturation conditions (blue and cyan curves).
Figure 5
Figure 5
Ten selected compounds from our previous publication on MAPRE1 for cooperativity studies [31]. Eight of them show significant %Amax values in the TR-FRET proximity assay, indicating ternary complex formation. Two compounds (S,S-SLF-1d and S,S-SLF-12) were selected as negative controls. S,S-SLF-1d differs only in the stereochemistry at the α-position of the 2-amido-4-methylene-pipecolinic moiety compared to R,S-SLF-1a. The green R or S indicates the position where the stereochemistry differs between compounds.
Figure 6
Figure 6
Binding data with experimentally derived and calculated cooperativity and Kds for R,--SLF-11. (b): The interpolated EC50 of the %Tbound, binary curve for binary binding to MAPRE1 is 1.8 mM. Due to the low [Ttot] = 5 nM, this EC50 was interpreted directly as KT,1. The presence of 10 µM FKBP12 resulted in a shift in the EC50 of the %Tbound. Ternary curve to 180 nM, which corresponds to an apparent cooperativity of 10,000. (a): EC50 of 254 nM of the %Cbound, binary curve corrected by 50% of [Ctot] = 40 nM to KC,1 = 234 nM. Using the full model with [Ctot] = 10,000 nM, [Ttot] = 5 nM, KC,1 = 234 nM, KT,1 = 1,800,000 nM and EC50 of 180 nM of the %Tbound, binary curve results in the cooperativity α = 10,405 and KT,2 = 173 nM. Running the same experiment in the opposite direction, i.e., via the other binding protein, with the EC50 = 66 nM of the %Cbound, ternary curve (instead of 24 nM) results in an apparent cooperativity of 3.8 relative to the calculated 10.5 using α = 10,405 from the EC50 of %Tbound, ternary curve. The trend towards underestimating EC50-shifts by factor 2 to 3 when determining cooperativity through FKBP12 is constant across all compounds. Possible reasons are discussed in the main text. An α = 10,405 results in KC,2 = 0.023 nM, which is below [Ctot] = 5 nM and indicates that the assay is bottoming out for FKBP12.
Figure 7
Figure 7
Binding and calculated data for R,S-SLF-6. For explanation of details, refer to Figure 6.
Figure 8
Figure 8
Binding and calculated data for R,--SLF-10. For explanation of details, refer to Figure 6.
Figure 9
Figure 9
Binding and calculated data for R,S-SLF-3. For explanation of details, refer to Figure 6.
Figure 10
Figure 10
Binding and calculated data for R,S-SLF-7. For explanation of details, refer to Figure 6.
Figure 11
Figure 11
Binding and calculated data for R,S-SLF-1a. For explanation of details, refer to Figure 6.
Figure 12
Figure 12
Binding and calculated data for R,S-SLF-8. For explanation of details, refer to Figure 6.
Figure 13
Figure 13
Binding and calculated data for the negative control compound R,S-SLF-12. (b): Neither binary nor ternary binding to MAPRE1 was observed for R,S-SLF-12, which is consistent with the results of the TR-FRET proximity assay (%Amax = 0%). This result indirectly shows that the observed bindings to MAPRE1 are real for the other compounds. (a): Confirming that there is no ternary binding for MAPRE1, no significant shift was observed for the binding of FKBP12 by the presence of 10 μM MAPRE1. This result confirms the clean correlation between the two directions of binding measurement through MAPRE1 and FKBP12, respectively.
Figure 14
Figure 14
Binding and calculated data for S,S-SLF-1d. (b): No binding to MAPRE1 was observed for the negative control compound S,S-SLF-1d, which is consistent with the results of the TR-FRET proximity assay (%Amax = 0%). This result indirectly shows that the observed binding to MAPRE1 is real for the other compounds tested. (a): As a consequence, no significant shift was observed. This result shows the clean correlation between the two directions of the binding measurements for MAPRE1 and FKBP12, respectively.
Figure 15
Figure 15
Measuring native protein–protein interaction. (a): The curve fit can be interpreted as non-binding since the observed amplitude is too small (note the fine scale of the y-axis). This may reflect either gaussian noise or very weak binding with protein affinities much greater than 100 µM. (b): This data points display the same interaction but in a reversed fashion, no binding is indicated, which suggests no MAPRE1–FKBP12 interaction (see also NMR experiments in our previous work) [31].
Figure 16
Figure 16
The trend correlation between cooperativity α and the previously reported %Amax values confirm that for the studied series of compounds, an increase in the concentration of ternary complexes (indicated by the increase in %Amax values) is driven by an increase in cooperativity α.
Figure 17
Figure 17
The ratio of [Ctot]/KC,1 determines the degree of saturation, which means that at EC50 all ligand (=[Ltot]) that is not bound into CLT (i.e., 50% of [Ttot]) is bound into CL. Under these conditions, the (normalized) difference between EC50–[Ttot]/2 and KT,2 approaches 0, which is the case for [Ctot]/KT,2 values greater than 200. The upper data point displayed at [Ctot]/KT,2 ≈ 460 should read 0 as x-value (experimental error, indicated by the arrow). The trend correlation shows the good accordance between the model and the experimental data.
Figure 18
Figure 18
Potential interactions between the His-tag (dark yellow licorice) of FKBP12 (blue cartoon) and MAPRE1 (surface) in presence of the molecular glue R,S-SLF-8 (white licorice). The electrostatic potential of MAPRE1 is color-coded between −5 (negatively charged, red) and +5 (positively charged, blue) in the unit of kbT/ec (kb is the Boltzmann constant, T is the temperature, and ec is the electron charge).

Similar articles

Cited by

References

    1. Kozicka Z., Thoma N.H. Haven’t got a glue: Protein surface variation for the design of molecular glue degraders. Cell Chem. Biol. 2021;28:1032–1047. doi: 10.1016/j.chembiol.2021.04.009. - DOI - PubMed
    1. Li F., Aljahdali I.A.M., Ling X. Molecular Glues: Capable Protein-Binding Small Molecules That Can Change Protein-Protein Interactions and Interactomes for the Potential Treatment of Human Cancer and Neurodegenerative Diseases. Int. J. Mol. Sci. 2022;23:6206. doi: 10.3390/ijms23116206. - DOI - PMC - PubMed
    1. Wu H., Yao H., He C., Jia Y., Zhu Z., Xu S., Li D., Xu J. Molecular glues modulate protein functions by inducing protein aggregation: A promising therapeutic strategy of small molecules for disease treatment. Acta Pharm. Sin. B. 2022;12:3548–3566. - PMC - PubMed
    1. Weagel E.G., Foulks J.M., Siddiqui A., Warner S.L. Molecular glues: Enhanced protein-protein interactions and cell proteome editing. Med. Chem. Res. 2022;31:1068–1087. doi: 10.1007/s00044-022-02882-2. - DOI
    1. Geiger T.M., Schäfer S.C., Dreizler J.K., Walz M., Hausch F. Clues to molecular glues. Curr. Res. Chem. Biol. 2022;2:100018.

LinkOut - more resources