

Molecular Signatures of Aeroallergen Sensitization in Pediatric Populations: A Comparative Study Across Spanish Cities
- PMID: 40243575
- PMCID: PMC11988508
- DOI: 10.3390/ijms26072963
Molecular Signatures of Aeroallergen Sensitization in Pediatric Populations: A Comparative Study Across Spanish Cities
Abstract
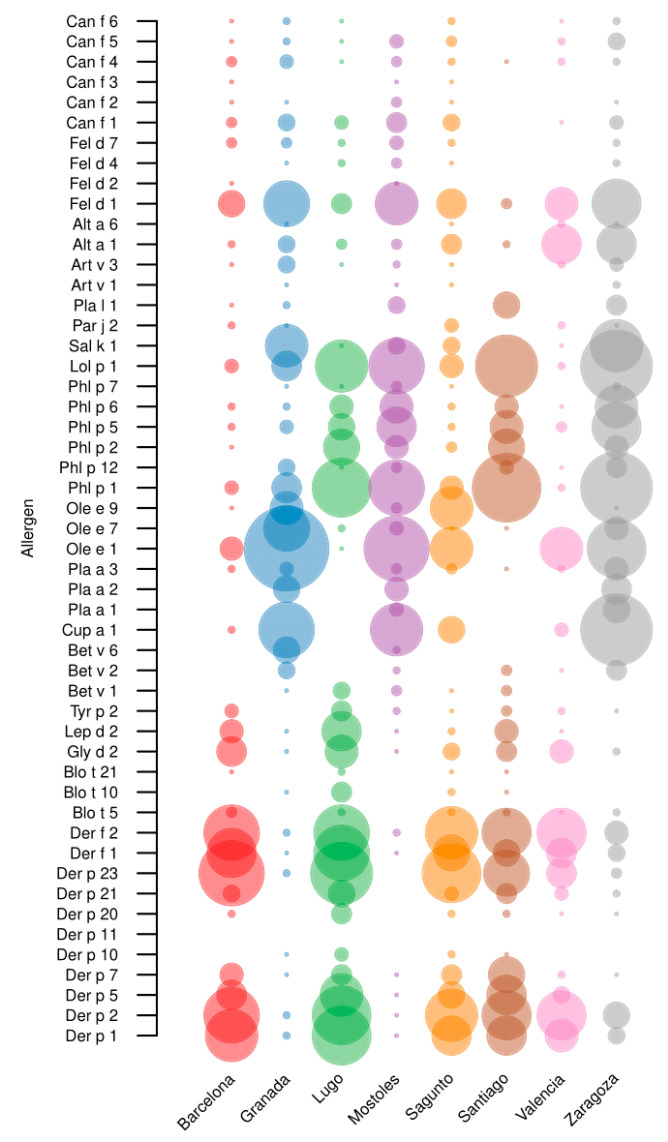
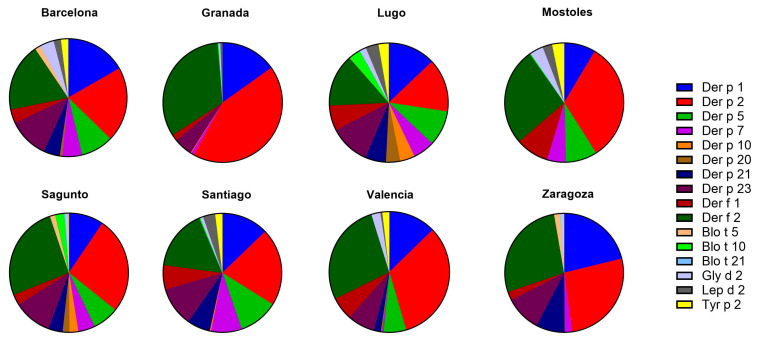
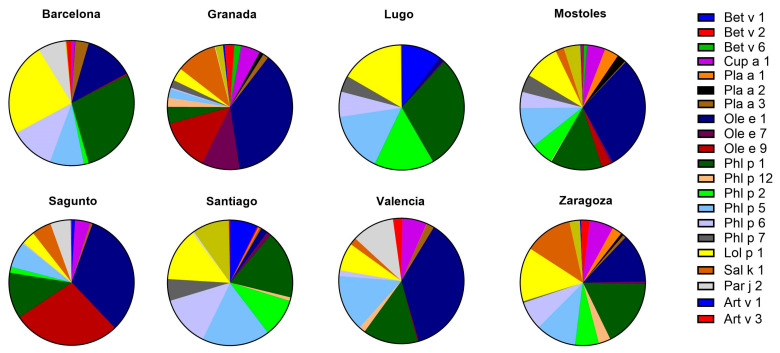
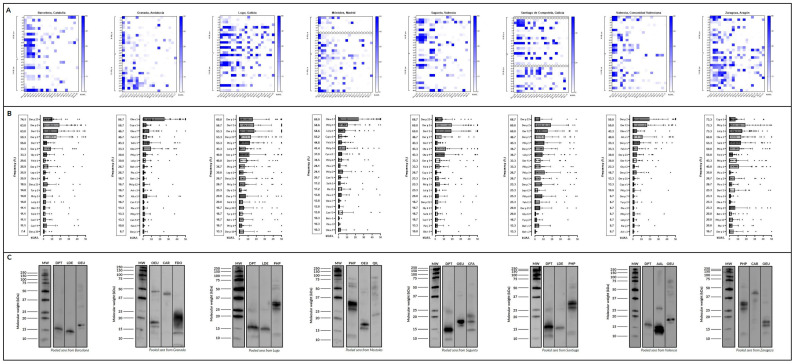
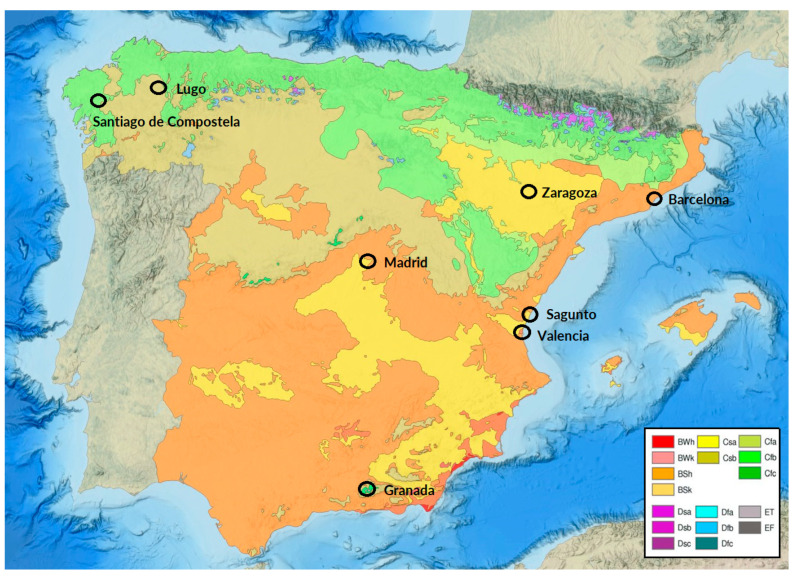
Spain exhibits significant climatic variability across its regions, ranging from the humid oceanic climate in the north to the Mediterranean and stepped climates in the southern and central areas. These climatic differences influence environmental allergen exposure, which may, in turn, affect allergic sensitization patterns in the pediatric population. Variations in temperature, humidity, and airborne allergen distribution, such as pollen, dust mites, animal epithelia, and mold, contribute to regional disparities in allergic responses among children. Understanding how climatic conditions shape allergen recognition patterns across different geographical areas is essential for improving allergy prevention and management strategies. This study aims to shed light on this issue by identifying sensitization patterns in a pediatric population of 236 patients (with 2 age groups analyzed: 6-10 and 11-15 years old) from different climatic regions of Spain. Skin tests with standard aeroallergens were performed, and specific IgE (sIgE) analysis by Allergy Explorer of Macroarray Diagnostic test (ALEX2) and Western blot. The results revealed different sensitization trends across patients from the eight cities analyzed (Barcelona, Granada, Lugo, Sagunto, Santiago de Compostela, Valencia, and Zaragoza).
Keywords: aerobiology; allergens; allergic asthma; allergic rhinitis; climate change; exposome.
Conflict of interest statement
Authors T.G., M.J.M. and F.P. were employed by the company Inmunotek S.L. The remaining authors declare that the research was conducted in the absence of any commercial or financial relationships that could be construed as a potential conflict of interest.
Figures
Similar articles
-
Molecular sensitisation patterns to aeroallergens in a Mediterranean paediatric population and their clinical implications.Allergol Immunopathol (Madr). 2025 May 1;53(3):72-79. doi: 10.15586/aei.v53i3.1298. eCollection 2025. Allergol Immunopathol (Madr). 2025. PMID: 40342116
-
Climate and Allergic Sensitization to Airborne Allergens in the General Population: Data from the French Six Cities Study.Int Arch Allergy Immunol. 2017;172(4):236-241. doi: 10.1159/000471511. Epub 2017 Apr 29. Int Arch Allergy Immunol. 2017. PMID: 28456804
-
Molecular Signatures of Aeroallergen Sensitization in Respiratory Allergy: A Comparative Study Across Climate-Matched Populations.Int J Mol Sci. 2024 Dec 31;26(1):284. doi: 10.3390/ijms26010284. Int J Mol Sci. 2024. PMID: 39796138 Free PMC article.
-
Impact of climate change on aerobiology, rhinitis, and allergen immunotherapy: Work Group Report from the Aerobiology, Rhinitis, Rhinosinusitis & Ocular Allergy, and Immunotherapy, Allergen Standardization & Allergy Diagnostics Committees of the American Academy of Allergy, Asthma & Immunology.J Allergy Clin Immunol. 2025 Jun;155(6):1767-1782.e2. doi: 10.1016/j.jaci.2025.01.048. Epub 2025 Apr 18. J Allergy Clin Immunol. 2025. PMID: 40252075 Review.
-
Aeroallergen sensitization and allergic disease phenotypes in Asia.Asian Pac J Allergy Immunol. 2016 Sep;34(3):181-189. doi: 10.12932/AP0770. Asian Pac J Allergy Immunol. 2016. PMID: 27543739 Review.
References
-
- González-de Paz L., Valdesoiro-Navarrete L., Roma J., Blat-Guimerà E., Benavent-Areu J., Bartra J., Sisó-Almirall A. Prevalence and Impact of Asthma and Allergy on Daily Life, Health Outcomes and Use of Healthcare Services in Children: A Population-Based Study. Arch. Bronconeumol. 2023;59:481–487. doi: 10.1016/J.ARBRES.2023.05.005. - DOI - PubMed
-
- Kiewiet M.B.G., Lupinek C., Vrtala S., Wieser S., Baar A., Kiss R., Kull I., Melén E., Wickman M., Porta D., et al. A Molecular Sensitization Map of European Children Reveals Exposome- and Climate-Dependent Sensitization Profiles. Allergy Eur. J. Allergy Clin. Immunol. 2023;78:2007–2018. doi: 10.1111/all.15689. - DOI - PubMed
-
- Lejeune S., Bouazza N., Nicaise P.R., Jolaine V., Roditis L., Marguet C., Amat F., Berger P., Fayon M., Dubus J.C., et al. COBRAPed Cohort: Do Sensitization Patterns Differentiate Children with Severe Asthma from Those with a Milder Disease? Pediatr. Allergy Immunol. 2024;35:e14112. doi: 10.1111/PAI.14112. - DOI - PubMed
Publication types
MeSH terms
Substances
LinkOut - more resources
Full Text Sources
Medical
