. 2025 Mar 24;26(7):2946.
doi: 10.3390/ijms26072946.

Cell Wall-Based Machine Learning Models to Predict Plant Growth Using Onion Epidermis

Affiliations

Cell Wall-Based Machine Learning Models to Predict Plant Growth Using Onion Epidermis

Celia Khoulali et al. Int J Mol Sci. .

Abstract

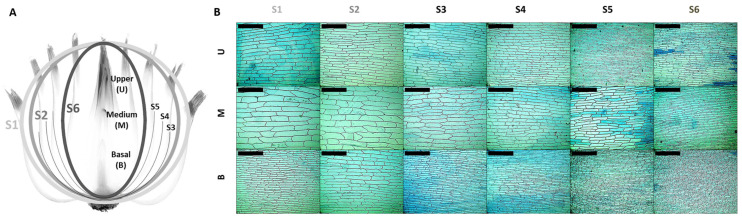
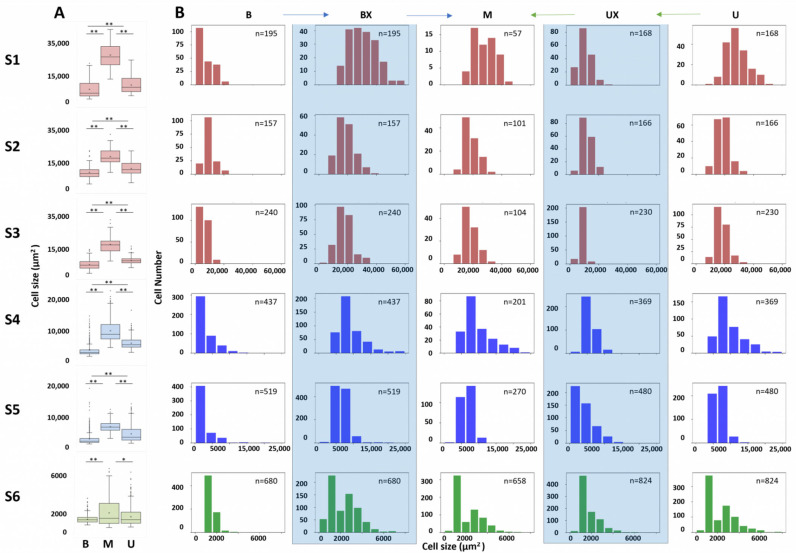
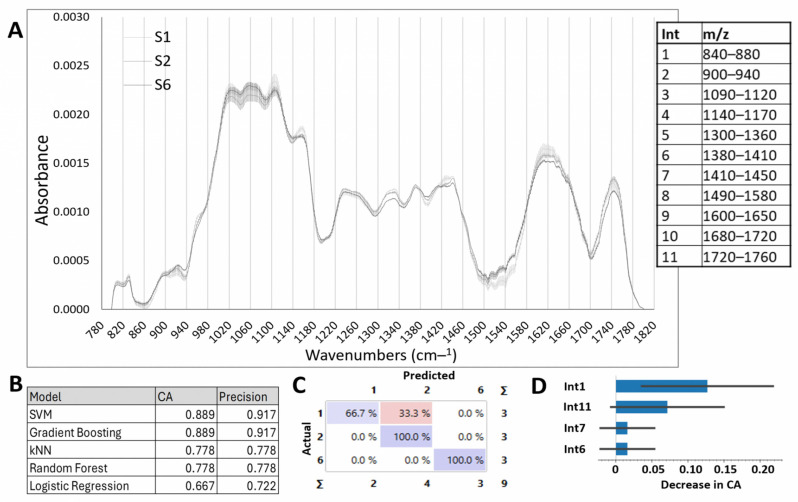
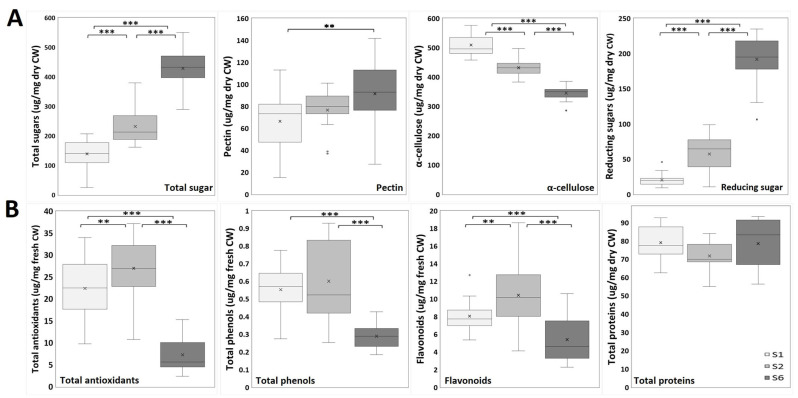
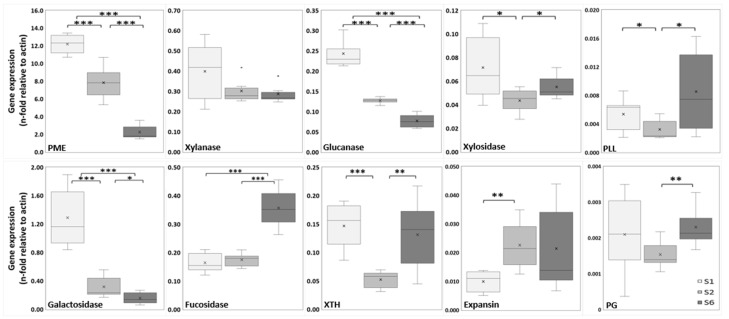
The plant cell wall (CW) is a physical barrier that plays a dual role in plant physiology, providing structural support for growth and development. Understanding the dynamics of CW growth is crucial for optimizing crop yields. In this study, we employed onion (Allium cepa L.) epidermis as a model system, leveraging its layered organization to investigate growth stages. Microscopic analysis revealed proportional variations in cell size in different epidermal layers, offering insights into growth dynamics and CW structural adaptations. Fourier transform infrared spectroscopy (FTIR) identified 11 distinct spectral intervals associated with CW components, highlighting structural modifications that influence wall elasticity and rigidity. Biochemical assays across developmental layers demonstrated variations in cellulose, soluble sugars, and antioxidant content, reflecting biochemical shifts during growth. The differential expression of ten cell wall enzyme (CWE) genes, analyzed via RT-qPCR, revealed significant correlations between gene expression patterns and CW composition changes across developmental layers. Notably, the gene expression levels of the pectin methylesterase and fucosidase enzymes were associated with the contents in cellulose, soluble sugar, and antioxidants. To complement these findings, machine learning models, including Support Vector Machines (SVM), k-Nearest Neighbors (kNN), and Neural Networks, were employed to integrate FTIR data, biochemical parameters, and CWE gene expression profiles. Our models achieved high accuracy in predicting growth stages. This underscores the intricate interplay among CW composition, CW enzymatic activity, and growth dynamics, providing a predictive framework with applications in enhancing crop productivity and sustainability.

Keywords: Allium cepa L.; cell wall composition; cell wall enzymes; machine learning; modeling; onion epidermis; plant growth.


Conflict of interest statement

The authors declare no conflicts of interest. The funders had no role in the design of the study; in the collection, analyses, or interpretation of data; in the writing of the manuscript; or in the decision to publish the results.

Figures

Figure 1
Figure 1
Structural organization and epidermal cell morphology in onion bulb layers. (A) Schema representing onion layers (S1 to S6) and the basal (B), medium (M), and upper (U) zones; (B) trypan blue staining of onion epidermal cells in layers S1–S6 and the B, M, and U zones. Layers S1, S2, and S6 are represented as three shades of grey. Scale bar: 400 μm.
Figure 2
Figure 2
Distribution of cell sizes and numbers in the different areas (basal, middle, and upper) of the onion layers (S1–S6). (A) Cell sizes in the different areas (basal, middle, and upper) of the onion layers (S1–S6). Kruskal–Wallis followed by Dunn’s test was used to analyze data from three independent biological repeats. Asterisks indicate significant differences * (p ≤ 0.001); ** (p ≤ 0.0001). (B) Distribution of cell sizes and numbers in the different areas (basal, middle, and upper) of the onion layers (S1–S6). The histograms show three colors associated with three different scales: S1, S2, and S3 contained full-scale cells (in red), S4 and S5 contained cells on an intermediate scale (in blue), and S6 exhibited smaller scale cells (in green). The columns with a light blue background correspond to the modified histograms. Graphical verification of the hypothesis of proportional cell size from the basal area (B and BX) to the middle area (M), with blue arrows and proportional cell size from the upper area (U and UX) to the middle, with green arrows.
Figure 3
Figure 3
Cell wall composition of the epidermal cells of onion layers and classification model. (A) FTIR analysis of the cell wall in layers S1, S2, and S6, showing eleven significant difference intervals. Spectra show the mean value (n = 3). (B) Classification accuracy (CA) and precision of the different models used in the eleven ranges from the FTIR dataset. (C) Confusion matrix for the SVM model (FTIR dataset). The confusion matrix shows the percentage of correctly (in purple) and incorrectly (in pink) classified instances. Columns represent predicted values, while rows represent true values. (D) Feature importance for the SVM model applied to the eleven ranges from the FTIR dataset.
Figure 4
Figure 4
Spectroscopic analysis of onion epidermal cells. (A) Onion epidermis cell wall analysis (n = 18): total sugars; uronic acids (pectins); total insoluble sugars (α-cellulose); reducing sugars. (B) Onion epidermis nutraceutical analysis (n = 18–33): total antioxidants; total phenols; flavonoids; total proteins. Unpaired Student’s t-test was used to analyze data from three independent biological repeats. Asterisks indicate significant differences ** (p ≤ 0.01); *** (p ≤ 0.001).
Figure 5
Figure 5
Scale classification by machine learning. (A) Classification accuracy (CA) and precision for the different models used in the CWC dataset. (B) Confusion matrix for the SVM model (CW biochemical dataset). The confusion matrix shows the percentage of correctly (in purple) and incorrectly (in pink) classified instances. Columns represent predicted values, while rows represent true values. (C) Feature importance for the SVM model. The histogram shows the significance of features importance for the SVM model in the classification of the CWC dataset. (D) Classification accuracy and precision for the different models used in the NUTC dataset. The tables indicate the methods that provided the best result in each case. (E) Confusion matrix for the SVM model (nutraceutical dataset). The matrix highlights well-predicted values along the diagonal, with S6 again being the best-predicted category. (F) Feature importance for the SVM model applied to the NUTC dataset.
Figure 6
Figure 6
Gene expression of the cell wall enzymes pectin methylesterase (PME), xylanase, glucanase, xylosidase, pectin/pectate lyase-like (PLL), galactosidase, fucosidase, xyloglucan endotransglycosylase/hydrolase (XTH), expansin and polygalacturonase (PG) and, as determined by RT-qPCR. The expression of CWE genes through the three growth stages was normalized to onion actin expression. Data from three independent biological repeats were analyzed by unpaired Student’s t-test (n = 6). Asterisks indicate significant differences * (p ≤ 0.05); ** (p ≤ 0.01); *** (p ≤ 0.001).

Similar articles

References

    1. Hilty J., Muller B., Pantin F., Leuzinger S. Plant growth: The What, the How, and the Why. New Phytol. 2021;232:25–41. doi: 10.1111/nph.17610. - DOI - PubMed
    1. Cosgrove D.J. Plant cell wall extensibility: Connecting plant cell growth with cell wall structure, mechanics, and the action of wall-modifying enzymes. J. Exp. Bot. 2016;67:463–476. doi: 10.1093/jxb/erv511. - DOI - PubMed
    1. Ali S., Huang S., Zhou J., Bai Y., Liu Y., Shi L., Liu S., Hu Z., Tang Y. miR397-LACs mediated cadmium stress tolerance in Arabidopsis thaliana. Plant Mol. Biol. 2023;113:415–430. doi: 10.1007/s11103-023-01369-x. - DOI - PubMed
    1. Höfte H., Voxeur A. Plant cell walls. Curr. Biol. 2017;27:R865–R870. doi: 10.1016/j.cub.2017.05.025. - DOI - PubMed
    1. Somerville C., Bauer S., Brininstool G., Facette M., Hamann T., Milne J., Osborne E., Paredez A., Persson S., Raab T., et al. Toward a Systems Approach to Understanding Plant Cell Walls. Science. 2004;306:2206–2211. doi: 10.1126/science.1102765. - DOI - PubMed

MeSH terms

LinkOut - more resources