Alterations in Gene Expression and Alternative Splicing Induced by Plasmid-Mediated Overexpression of GFP and P2RY12 Within the A549 Cell Line
- PMID: 40243586
- PMCID: PMC11988474
- DOI: 10.3390/ijms26072973
Alterations in Gene Expression and Alternative Splicing Induced by Plasmid-Mediated Overexpression of GFP and P2RY12 Within the A549 Cell Line
Abstract
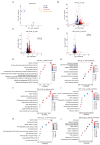
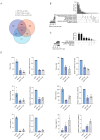
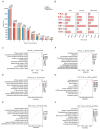
Phenotypic modifications and their effects on cellular functions through the up-regulation of target gene expression have frequently been observed in genetic studies, but the unique roles of cell lines and their introduced plasmids in influencing these functions have not been fully revealed. In this research, we developed two distinct cell lines derived from the A549 cell line: one that stably overexpresses GFP and another that is a polyclonal stable line overexpressing both GFP and P2RY12. We then utilized transcriptome sequencing (RNA-seq) technology to screen out differentially expressed genes (DEGs) and genes with differential transcript usage (gDTUs) after GFP overexpression (GFP-OE) and P2RY12 overexpression (P2RY12-OE). We found that, compared with A549, there were more than 1700 differentially expressed genes (DEGs) in both GFP-OE and P2RY12-OE cells, while only 866 DEGs were identified in GFP-OE and P2RY12-OE cells. Notably, the differences in transcript usage were relatively minor, with only over 400 genes exhibiting changes across all three groups. The functional analysis of DEGs and gDTUs showed that they were both highly enriched in the pathways associated with cell proliferation and migration. In summary, we performed an extensive analysis of the transcriptome profile of gene expression and alternative splicing with GFP-OE and P2RY12-OE, enhancing our comprehension of how genes function within cells and the processes that control gene expression.
Keywords: A549; DEGs; GFP; P2RY12; gDTUs; overexpression cell line.
Conflict of interest statement
The authors declare no conflicts of interest.
Figures


Similar articles
-
Transduction of Lentiviral Vectors and ADORA3 in HEK293T Cells Modulated in Gene Expression and Alternative Splicing.Int J Mol Sci. 2025 May 7;26(9):4431. doi: 10.3390/ijms26094431. Int J Mol Sci. 2025. PMID: 40362672 Free PMC article.
-
Prognostic value and immune infiltration of a novel stromal/immune score-related P2RY12 in lung adenocarcinoma microenvironment.Int Immunopharmacol. 2021 Sep;98:107734. doi: 10.1016/j.intimp.2021.107734. Epub 2021 Jun 25. Int Immunopharmacol. 2021. PMID: 34175738
-
RNA-binding protein CELF6 modulates transcription and splicing levels of genes associated with tumorigenesis in lung cancer A549 cells.PeerJ. 2022 Jul 26;10:e13800. doi: 10.7717/peerj.13800. eCollection 2022. PeerJ. 2022. PMID: 35910766 Free PMC article.
-
[Establishment of Dual Fluorescent Labeled Human High Bone Metastasis Lung Adenocarcinoma Cell Line and Transcriptomic Characterization Analysis].Zhongguo Fei Ai Za Zhi. 2024 Apr 20;27(4):257-265. doi: 10.3779/j.issn.1009-3419.2024.101.09. Zhongguo Fei Ai Za Zhi. 2024. PMID: 38769828 Free PMC article. Chinese.
-
Microglia and Neuroinflammation: What Place for P2RY12?Int J Mol Sci. 2021 Feb 6;22(4):1636. doi: 10.3390/ijms22041636. Int J Mol Sci. 2021. PMID: 33561958 Free PMC article. Review.
References
MeSH terms
Substances
LinkOut - more resources
Full Text Sources

