

Mitochondrial Small RNA Alterations Associated with Increased Lysosome Activity in an Alzheimer's Disease Mouse Model Uncovered by PANDORA-seq
- PMID: 40243634
- PMCID: PMC11988842
- DOI: 10.3390/ijms26073019
Mitochondrial Small RNA Alterations Associated with Increased Lysosome Activity in an Alzheimer's Disease Mouse Model Uncovered by PANDORA-seq
Abstract
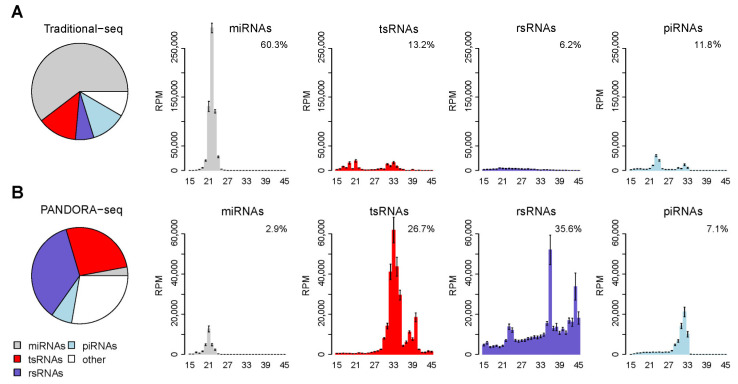
Emerging small non-coding RNAs (sncRNAs), including tRNA-derived small RNAs (tsRNAs) and rRNA-derived small RNAs (rsRNAs), are critical in various biological processes, such as neurological diseases. Traditional sncRNA-sequencing (seq) protocols often miss these sncRNAs due to their modifications, such as internal and terminal modifications, that can interfere with sequencing. We recently developed panoramic RNA display by overcoming RNA modification aborted sequencing (PANDORA-seq), a method enabling comprehensive detection of modified sncRNAs by overcoming the RNA modifications. Using PANDORA-seq, we revealed a previously unrecognized sncRNA profile enriched by tsRNAs/rsRNAs in the mouse prefrontal cortex and found a significant downregulation of mitochondrial tsRNAs and rsRNAs in an Alzheimer's disease (AD) mouse model compared to wild-type controls, while this pattern is not present in the genomic tsRNAs and rsRNAs. Moreover, our integrated analysis of gene expression and sncRNA profiles reveals that those downregulated mitochondrial sncRNAs negatively correlate with enhanced lysosomal activity, suggesting a crucial interplay between mitochondrial RNA dynamics and lysosomal function in AD. Given the versatile tsRNA/tsRNA molecular actions in cellular regulation, our data provide insights for future mechanistic study of AD with potential therapeutic strategies.
Keywords: Alzheimer’s disease; lysosome; mitochondrial; small non-coding RNAs (sncRNAs); tRNA-derived small RNAs.
Conflict of interest statement
The authors declare no conflicts of interest.
Figures


Update of
-
Mitochondrial small RNA alterations associated with increased lysosome activity in an Alzheimer's Disease Mouse Model uncovered by PANDORA-seq.bioRxiv [Preprint]. 2024 Oct 22:2024.10.18.619155. doi: 10.1101/2024.10.18.619155. bioRxiv. 2024. Update in: Int J Mol Sci. 2025 Mar 26;26(7):3019. doi: 10.3390/ijms26073019. PMID: 39484605 Free PMC article. Updated. Preprint.
Similar articles
-
Mitochondrial small RNA alterations associated with increased lysosome activity in an Alzheimer's Disease Mouse Model uncovered by PANDORA-seq.bioRxiv [Preprint]. 2024 Oct 22:2024.10.18.619155. doi: 10.1101/2024.10.18.619155. bioRxiv. 2024. Update in: Int J Mol Sci. 2025 Mar 26;26(7):3019. doi: 10.3390/ijms26073019. PMID: 39484605 Free PMC article. Updated. Preprint.
-
PANDORA-Seq unveils the hidden small noncoding RNA landscape in atherosclerosis of LDL receptor-deficient mice.J Lipid Res. 2023 Apr;64(4):100352. doi: 10.1016/j.jlr.2023.100352. Epub 2023 Mar 4. J Lipid Res. 2023. PMID: 36871792 Free PMC article.
-
PANDORA-seq expands the repertoire of regulatory small RNAs by overcoming RNA modifications.Nat Cell Biol. 2021 Apr;23(4):424-436. doi: 10.1038/s41556-021-00652-7. Epub 2021 Apr 5. Nat Cell Biol. 2021. PMID: 33820973 Free PMC article.
-
Transfer RNA-derived small RNAs (tsRNAs): Versatile regulators in cancer.Cancer Lett. 2022 Oct 10;546:215842. doi: 10.1016/j.canlet.2022.215842. Epub 2022 Aug 11. Cancer Lett. 2022. PMID: 35964819 Review.
-
An old friend with a new face: tRNA-derived small RNAs with big regulatory potential in cancer biology.Br J Cancer. 2023 May;128(9):1625-1635. doi: 10.1038/s41416-023-02191-4. Epub 2023 Feb 9. Br J Cancer. 2023. PMID: 36759729 Free PMC article. Review.
Cited by
-
Small RNA and Toll-like receptor interactions: origins and disease mechanisms.Trends Biochem Sci. 2025 May;50(5):385-401. doi: 10.1016/j.tibs.2025.01.004. Epub 2025 Feb 15. Trends Biochem Sci. 2025. PMID: 39956743 Review.
-
Understanding tsRNAs: From classification to disease mechanisms.iScience. 2025 May 9;28(6):112614. doi: 10.1016/j.isci.2025.112614. eCollection 2025 Jun 20. iScience. 2025. PMID: 40510126 Free PMC article. Review.
References
-
- World Health Organization . The Global Dementia Observatory Reference Guide. World Health Organization; Geneva, Switzerland: 2018.
-
- Chhatwal J.P., Schultz S.A., McDade E., Schultz A.P., Liu L., Hanseeuw B.J., Joseph-Mathurin N., Feldman R., Fitzpatrick C.D., Sparks K.P., et al. Dominantly Inherited Alzheimer’s Network, I. Variant-dependent heterogeneity in amyloid beta burden in autosomal dominant Alzheimer’s disease: Cross-sectional and longitudinal analyses of an observational study. Lancet Neurol. 2022;21:140–152. - PMC - PubMed
-
- Gotz J., Bodea L.G., Goedert M. Rodent models for Alzheimer disease. Nat. Rev. Neurosci. 2018;19:583–598. - PubMed
-
- Lauretti E., Dabrowski K., Pratico D. The neurobiology of non-coding RNAs and Alzheimer’s disease pathogenesis: Pathways, mechanisms and translational opportunities. Ageing Res. Rev. 2021;71:101425. - PubMed
MeSH terms
Substances
Grants and funding
- #S10 OD026929/National Institutes of Health SIG
- P20 GM130459/GM/NIGMS NIH HHS/United States
- R01 HD092431/HD/NICHD NIH HHS/United States
- R01 HL122770/HL/NHLBI NIH HHS/United States
- R01 DK135621/DK/NIDDK NIH HHS/United States
- S10 OD026929/OD/NIH HHS/United States
- K01 HL138215/HL/NHLBI NIH HHS/United States
- R35 HL155008/HL/NHLBI NIH HHS/United States
- R33 NS115132/NS/NINDS NIH HHS/United States
- K01HL138215, R01AG081935, P20GM130459,R33NS115132, R35HL155008,R01HD092431, R01ES032024, R01HL122770, R01DK135621/NH/NIH HHS/United States
- R01 AG081935/AG/NIA NIH HHS/United States
- R01 ES032024/ES/NIEHS NIH HHS/United States
LinkOut - more resources
Full Text Sources
Medical
Molecular Biology Databases
