. 2025 Mar 26;26(7):3054.
doi: 10.3390/ijms26073054.

Control of Conformational Transitions by the Conserved GX9P Motif in the Fifth Transmembrane Domain of Neurotransmitter Sodium Symporters

Affiliations

Control of Conformational Transitions by the Conserved GX9P Motif in the Fifth Transmembrane Domain of Neurotransmitter Sodium Symporters

Xintong Zhang et al. Int J Mol Sci. .

Abstract

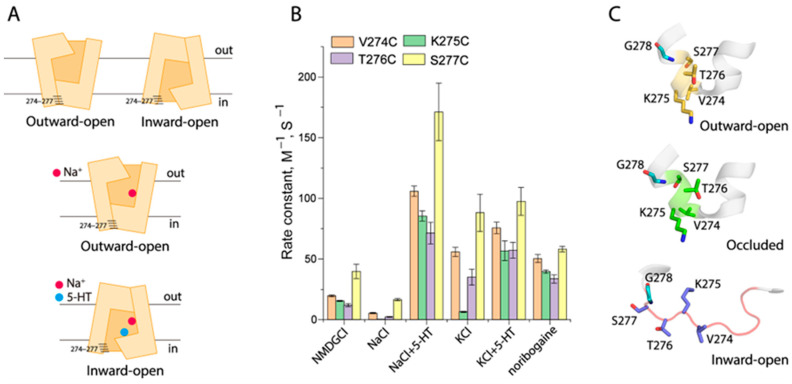
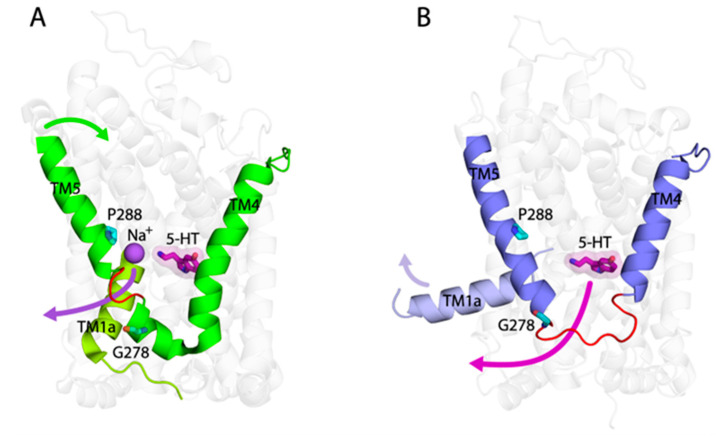
The neurotransmitter sodium symporters (NSSs) play critical roles in the neurotransmission of monoamine and amino acid neurotransmitters and are the molecular targets of therapeutic agents in the treatment of several psychiatric disorders. Despite significant progress in characterizing structures and transport mechanisms, the management of conformational transitions by structural elements coupled with ion and substrate binding remains to be fully understood. In the present study, we biochemically identified a conserved GX9P motif in the fifth transmembrane domain (TM5) of the serotonin transporter (SERT) that plays a vital role in its transport function by facilitating conformational transitions. Mutations of the conserved Gly278 or Pro288 in the GX9P motif dramatically decreased specific transport activity by reducing the substrate binding-induced conformational transitions from an outward-open to an inward-open conformation. In addition, cysteine accessibility measurements demonstrated that the unwinding of the intracellular part of TM5 occurs during conformational transitions from an outward-open state, through an occluded state, to an inward-open state and that substrate binding triggers TM5 unwinding. Furthermore, mutations of the GX9P motif were shown to result in destructive effects on TM5 unwinding, suggesting that the GX9P motif controls conformational transitions through TM5 unwinding. Taken together, the present study provides new insights into the structural elements controlling conformational transitions in NSS transporters.

Keywords: GX9P motif; TM5 unwinding; conformational transition; neurotransmitter sodium symporter; serotonin transporter; transport mechanism.


Conflict of interest statement

The authors declare no conflicts of interest with the contents of this article.

Figures

Figure 1
Figure 1
Amino acid sequence alignment of the NSS transporters and structural comparison of the GX9P motif in SERT. (A) Amino acid sequence alignment of the intracellular part of TM5 of several eukaryotic NSS transporters and bacterial members. Each line represents a different sequence with the residue number preceding the sequence. The GX9P motifs in bacterial and eukaryotic NSS transporters are highlighted in green and blue background, respectively. The conserved glycine and proline residues are marked by red rectangles. (BD) Structural comparison of the GX9P motif of SERT in an outward-open ((B), PDB code, 6DZY), an occluded ((C), 6DZV), and an inward-open conformation ((D), 6DZZ). The conserved glycine and proline residues are colored cyan in each structure. The unwinding regions in TM5 are shown in red loops.
Figure 2
Figure 2
Functional analysis for the mutants of the GX9P motif. (A) Relative initial transport activity. 5-HT uptake was measured by incubation of the cells stably expressing SERT-WT or each GX9P mutant with 20 nM [3H]5-HT at 22 °C for 10 min, as described in Section 4. Transport activity was expressed as a percentage of the value obtained with SERT-WT. n = 3. (B) Kinetic analysis for SERT-WT, G278A, and P288L. Transport assay was performed by incubation of the cells stably expressing SERT-WT, G278A, or P288L with a range of 5-HT concentrations (0–10 μM), as described in Section 4. The graph shows a representative experiment with triplicate measurements at each 5-HT concentration. n = 3. (C) Kinetic parameters and specific transport activities of SERT-WT, G278A, and P288L. Vmax and Km values are presented as mean ± SEM (n = 3). Specific transport activity (Vmax/expression) is expressed as a ratio of Vmax normalized to the cell surface expression relative to SERT-WT, and presented as mean ± SEM (n = 3). * p < 0.05, ** p < 0.01, *** p < 0.0001, compared to WT. (D) Cell surface expression of SERT-WT, G278A, and P288L. Biotinylation of SERT expression on the cell surface was performed as described in Section 4. Cell surface expression is expressed as a percentage of the integrated density of SERT-WT normalized to the internal GAPDH (n = 3). Insert shows representative immunoblots of biotinylated SERT and internal GAPDH.
Figure 3
Figure 3
Effects of the GX9P mutations on conformation of the extracellular pathway in SERT. (A) MTSET concentration-dependent inhibition of 5-HT uptake by Y107C/C109A. (B) MTSET concentration-dependent inhibition of 5-HT uptake by Y107C/C109A/G278A. (C) MTSET concentration-dependent inhibition of 5-HT uptake by Y107C/C109A/P288L. In (AC), MTSET inhibition was parallelly examined under different conditions, such as NMDGCl (control), NaCl, or 5-HT/NaCl, as described in Section 4. The graphs show representative experiments for each mutant, respectively. n = 3. (D) Schematic presentation of Cys107 positions in response to different conformations of SERT. Cl ion was set to bind to the Cl site in all conformational states. Upper panel shows SERT under the control conditions with NMDGCl, in which SERT presents in a dynamic equilibrium between the outward-open and inward-open conformational states, while middle and lower panels represent SERT under NaCl and 5-HT/NaCl, respectively. (E) Rate constants for the reactivities with MTSET. The MTSET concentration giving half-maximal inhibition of 5-HT uptake in the cells (AC) was used to calculate rate constant for the reactivity with MTSET. Error bars represent ± SEM. n = 3. * p < 0.05, ** p < 0.01, compared to the corresponding control rate constant obtained with NMDGCl. ## p < 0.01, compared to the corresponding rate constant obtained with NaCl. (F) Accessibility change of each indicated mutant between two conditions, expressed as ratios of rate constants, such as a ratio of rate constants under NaCl over NMDGCl or a ratio of rate constants under 5-HT+NaCl over NaCl. The dotted line shows no accessibility change between two conditions (accessibility change fold is 1). * p < 0.05, ** p < 0.01, compared to Y107C (n = 3).
Figure 4
Figure 4
Conformational analysis for the unwinding of the middle of TM5. (A) Schematic presentation of positions of the residues 281–284 in the middle of TM5 in response to different conformations of SERT. A Cl ion was set to bind to the Cl site in all conformational states. The upper panel shows SERT under the control conditions with NMDGCl, in which SERT presents in a dynamic equilibrium between the outward-open and inward-open conformational states, while the middle and lower panels represent SERT under NaCl and 5-HT/NaCl, respectively. (B) Rate constants of cysteine mutants in the middle of TM5 under various ion and substrate binding conditions. MTSEA concentration-dependent inhibition of ASP+ binding was performed as described in Section 4 (Figures S1 and S2). The MTSEA concentration giving half-maximal inhibition of ASP+ binding was used to calculate rate constant for the reactivity with MTSEA. Error bars represent ±SEM (n = 3). (C) Structural comparison of the unwinding region in the middle of TM5 in an outward-open (PDB code, 6DZY), an occluded (6DZV), and an inward-open (6DZZ) conformation. The conserved glycine and proline residues are colored cyan in each structure. The unwinding region in the middle of TM5 is shown in a red loop.
Figure 5
Figure 5
Effects of the GX9P mutations on unwinding in the middle of TM5. Effects of G278A or P288L on rate constants for the reactivities with MTSEA of V281C (A) or W282C (B) under various ion and substrate binding conditions were examined by measuring inhibition of ASP+ binding by MTSEA over a range of concentrations (Figure S3). MTSEA concentration-dependent inhibition of ASP+ binding was determined as described in Section 4. The MTSEA concentration causing half-maximal inhibition of ASP+ binding was used to calculate rate constant for the reactivity with MTSEA. Error bars represent ±SEM (n = 3). * p < 0.05, ** p < 0.01, *** p < 0.001, compared to the corresponding control rate constant obtained with NMDGCl.
Figure 6
Figure 6
Conformational analysis for unwinding at the intracellular end of TM5. (A) Schematic presentation of positions of residues 274–277 at the intracellular end of TM5 in response to different conformations of SERT. Cl ion was set to bind to the Cl site in all conformational states. Upper panel shows SERT under the control conditions with NMDGCl, in which SERT presents in a dynamic equilibrium between the outward-open and inward-open conformational states, while middle and lower panels represent SERT under NaCl and 5-HT/NaCl, respectively. (B) Rate constants of cysteine mutants at the intracellular end of TM5 under various ion and substrate binding conditions. MTSEA concentration-dependent inhibition of ASP+ binding was determined as described in Section 4 (Figure S4). The MTSEA concentration causing half-maximal inhibition of ASP+ binding was used to calculate the rate constant for the reactivity with MTSEA. Error bars represent ±SEM (n = 3). (C) Structural comparison of the intracellular end of TM5 in an outward-open (PDB code, 6DZY), an occluded (6DZV), and an inward-open (6DZZ) conformation. The conserved glycine residue is colored cyan in each structure. The unwinding region in the intracellular end of TM5 is shown in a red loop.
Figure 7
Figure 7
Effects of the GX9P mutations on unwinding at the intracellular end of TM5. Effects of G278A or P288L on rate constants for the reactivities of T276C (A) or S277C (B) with MTSEA under various ion and substrate binding conditions were examined, respectively. MTSEA concentration-dependent inhibition of ASP+ binding was determined as described in Section 4 (Figure S5). The MTSEA concentration giving half-maximal inhibition of ASP+ binding was used to calculate rate constant for reactivity with MTSEA. Error bars represent ±SEM (n = 3). * p < 0.05, ** p < 0.01, compared to the corresponding control rate constant obtained with NMDGCl.
Figure 8
Figure 8
The proposed structural and functional role of TM5 in 5-HT transport by SERT. SERT is in an occluded (A) or inward-open (B) conformational state, respectively. The conserved glycine and proline residues are colored cyan in each structure. The unwinding regions in TM5 are shown in red loops. Arrows in green or purple in (A) show TM5 or Na+ (Na2) movement, while arrows in blue or purple in (B) show TM1a or 5-HT movement, respectively.

Similar articles

References

    1. Kristensen A.S., Andersen J., Jørgensen T.N., Sørensen L., Eriksen J., Loland C.J., Strømgaard K., Gether U. SLC6 neurotransmitter transporters: Structure, function, and regulation. Pharmacol. Rev. 2011;63:585–640. doi: 10.1124/pr.108.000869. - DOI - PubMed
    1. Chen N.-H., Reith M.E.A., Quick M.W. Synaptic uptake and beyond: The sodium- and chloride-dependent neurotransmitter transporter family SLC6. Pflugers Arch. Eur. J. Physiol. 2004;447:519–531. doi: 10.1007/s00424-003-1064-5. - DOI - PubMed
    1. Kurian M.A., Gissen P., Smith M., Heales S., Jr., Clayton P.T. The monoamine neurotransmitter disorders: An expanding range of neurological syndromes. Lancet Neurol. 2011;10:721–733. doi: 10.1016/s1474-4422(11)70141-7. - DOI - PubMed
    1. Rudnick G., Krämer R., Blakely R.D., Murphy D.L., Verrey F. The SLC6 transporters: Perspectives on structure, functions, regulation, and models for transporter dysfunction. Pflugers Arch. Eur. J. Physiol. 2014;466:25–42. doi: 10.1007/s00424-013-1410-1. - DOI - PMC - PubMed
    1. Rudnick G. Bioenergetics of neurotransmitter transport. J. Bioenerg. Biomembr. 1998;30:173–185. doi: 10.1023/a:1020573325823. - DOI - PubMed

Substances

LinkOut - more resources