. 2025 Mar 26;26(7):3045.
doi: 10.3390/ijms26073045.

Bilayer-Forming Lipids Enhance Archaeal Monolayer Membrane Stability

Affiliations

Bilayer-Forming Lipids Enhance Archaeal Monolayer Membrane Stability

Margot Saracco et al. Int J Mol Sci. .

Abstract

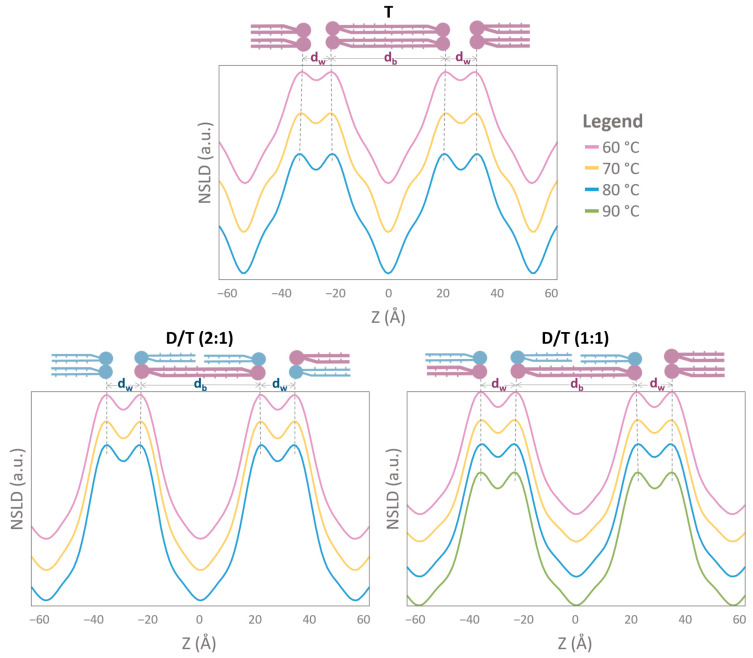
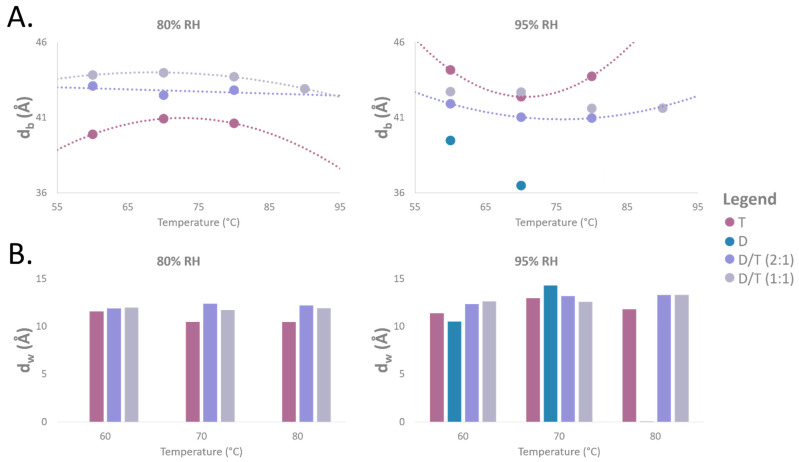
Archaeal membranes exhibit remarkable stability under extreme environmental conditions, a feature attributed to their unique lipid composition. While it is widely accepted that tetraether lipids confer structural integrity by forming monolayers, the role of bilayer-forming diether lipids in membrane stability remains unclear. Here, we demonstrate that incorporating diethers into archaeal-like lipid assemblies enhances membrane organization and adaptability under thermal stress. Using neutron diffraction, we show that membranes composed of mixed diethers and tetraethers exhibit greater structural order and stability compared to pure lipid systems. Contrary to expectations, monolayer-forming tetraethers alone display increased variability in lamellar spacing under fluctuating temperature and humidity, whereas mixed lipid membranes maintain a consistent architecture. Furthermore, neutron-scattering length density profiles reveal an unexpected density feature at the bilayer midplane, challenging conventional models of archaeal monolayer organization. These findings suggest that molecular diversity of lipid molecules, rather than tetraether dominance, plays a critical role in membrane auto-assembly, stability, and adaptability. Our results provide new insights into archaeal membrane adaptation strategies, with implications for the development of bioinspired, robust synthetic membranes for industrial and biomedical applications.

Keywords: Archaea; archaeal lipids; membrane biophysics; monolayer membrane; neutron diffraction; temperature stability; tetraether.


Conflict of interest statement

The authors declare no conflicts of interest.

Figures

Figure 1
Figure 1
Schematic representation of PI-DGD purification steps and identification of the hexose head groups. (1) HPLC-ESI-MS (negative ions) base peak chromatogram of IPLs of P. furiosus wild-type strain; I: P-DGD; II: PG-DGD; III: PHexNHAc-DGD; IV: PHex-DGD. (2) Purification of PHex-DGD by two-dimensional thin layer chromatography (1D = (TCM/MeOH/H2O; 75:25:2.5; v/v/v); 2D = (TCM/MeOH/AcOH/H2O; 80:9:12:2; v/v/v/v) [43]. (3) HPLC-ESI-MS (negative ions) base peak chromatogram for controlling the purity of the isolated compound PHex-DGD. (4) Methanolysis of the purified PHex-DGD followed by acetylation and GC-FID analysis to identify the hexose head groups.
Figure 2
Figure 2
Characterization of the tetraether mixture isolated from the lipid extract from S. acidocaldarius. (A) HPLC-ESI-MS (negative ions) base peak chromatogram of the tetraether polar lipid fraction isolated from S. acidocaldarius. (B) Gas chromatogram (GC-FID) showing the sugar head groups recovered upon methanolysis of the isolated tetraether mixture from S. acidocaldarius. The sugars are analyzed as acetate derivatives. *: contaminations. (C) HPLC-APCI-MS (positive ions) base peak chromatogram of the core lipids recovered upon methanolysis of the tetraether polar lipid fraction isolated from S. acidocaldarius. GDGT-0-6: Glycerol dialkyl glycerol tetraether with 0 to 6 cyclopentane rings. GDGT-4* = structural isomer of GDGT-4. Cal-GDGT-0-6: Calditol-GDGT with 0 to 6 cyclopentane rings.
Figure 3
Figure 3
Neutron diffraction of multilayer samples with varying concentrations of purified tetraether (T) and diether lipids (D). (A) Reciprocal space maps resulting from typical Ω-scans/(2θ, Ω) showing the Bragg peak positions of the different lipid samples, run at 100% D2O 70 °C 80% RH. (B) 1D integrated intensity along the Z direction of the different lipid samples, highlighting Bragg peak intensities, run at 100% D2O 70 °C. Red lines represent 80% RH measurements, and blue lines 95% RH measurements. D = diether sample, T = tetraether sample, D/T = mixture of diether and tetraether at different molar ratios (1:1) or (2:1).
Figure 4
Figure 4
Lamellar d-spacing as a function of temperature and relative humidity for different lipid compositions. Measured at 80% and 95% RH at 60 °C, 70 °C, and 80 °C. Only one sample was measured at 90 °C. The d-spacing was calculated only from 8% D2O measurements (see methods). D = diether sample, T = tetraether sample, D/T = mixture of diether and tetraether polar lipids at different molar ratios (1:1) and (2:1). A problem occurred during the diether measurement at 80 °C 95% RH, and it was thus not possible to calculate d-spacing for this sample.
Figure 5
Figure 5
Neutron Scattering Length Density (NSLD) profiles showing two periods of different archaeal membrane compositions. Each plot corresponds to the NSLD profile at one humidity level (80% RH) and different temperatures. The bilayer thickness db corresponds to the center-to-center distance between headgroups as described in the methods. The water layer thickness dw is calculated according to d = dw − db, d being the d-spacing. The dotted black lines show the shift of the maxima in the NSLD profiles. NSLD profiles were calculated with 4 orders for T and both D/T samples. In these conditions, only 2 orders were detected for the D sample, and the NSLD profile was not calculated. Due to the lack of resolution normally provided by higher diffraction orders, a diether membrane would lead to a wrong or featureless profile. T = tetraether sample, D/T = mixture of diether and tetraether samples at different molar ratios (1:1) or (2:1).
Figure 6
Figure 6
NSLD profiles showing two periods of different archaeal membrane compositions. Each plot corresponds to the NSLD profile at one humidity level (95% RH) and different temperatures. The bilayer thickness db corresponds to the center-to-center distance between headgroups as described in the methods. The water layer thickness dw is calculated according to d = dw − db, d being the d-spacing. The dotted black lines show the shift of the maxima in the NSLD profiles. NSLD profiles were calculated with 3 orders for D samples and 4 for T, and both D/T samples. A problem occurred during the diether measurement at 80 °C 95% RH. For this reason, it was not possible to calculate NLSD profile for this sample. D = diether sample, T = tetraether sample, D/T = mixture of diether and tetraether sample at different molar ratios (1:1) or (2:1).
Figure 7
Figure 7
Overlaid NSLD profiles. Each graph corresponds to an NSLD profile at different temperatures and humidities. The dotted black lines show the shift of the maxima in the NSLD profiles. NSLD profiles were calculated with 4 orders for T and both D/T samples. NSLD profiles were calculated with 3 orders for D samples. A problem occurred during the diether measurement at 80 °C 95% RH. For this reason, it was not possible to calculate NLSD profile for this sample. At 80% RH, only 2 orders were detected for the D; the NSLD profile was not calculated. D = diether sample, T = tetraether sample, D/T = mixture of diether and tetraether sample at different molar ratios (1:1) or (2:1).
Figure 8
Figure 8
Overlaid of membrane NLSD profile and the specific density profiles of water, headgroups, and methyl groups (CH2 and CH3) in 95% hydrated membranes. For membranes composed of: D = diether sample, T = tetraether sample, D/T = mixture of diether and tetraether sample at different molar ratios (1:1) or (2:1).
Figure 9
Figure 9
Thickness measurements for the different samples. (A) Membrane thickness (db) as a function of temperature for different lipids ratios, measured at 80% and 95% RH. Error for db measurements is ±0.5 Å. (B) Water thickness (dw) as a function of temperature for different lipids ratios, measured at 80% and 95% RH. Error for dw measurements is ±0.5 Å. D = diether sample, T = tetraether sample, D/T = mixture of diether and tetraether sample at different molar ratios (1:1) or (2:1). No data was available for the diether sample at 80% RH for all tested temperatures and at 80 °C with 95% RH.

Similar articles

References

    1. Konings W.N., Albers S.-V., Koning S., Driessen A.J.M. The Cell Membrane Plays a Crucial Role in Survival of Bacteria and Archaea in Extreme Environments. Antonie Van Leeuwenhoek. 2002;81:61–72. doi: 10.1023/A:1020573408652. - DOI - PubMed
    1. Shi Y., Cai M., Zhou L., Wang H. The Structure and Function of Cell Membranes Studied by Atomic Force Microscopy. Semin. Cell Dev. Biol. 2018;73:31–44. doi: 10.1016/j.semcdb.2017.07.012. - DOI - PubMed
    1. Hazel J.R. Thermal Adaptation in Biological Membranes: Is Homeoviscous Adaptation the Explanation? Annu. Rev. Physiol. 1995;57:19–42. doi: 10.1146/annurev.ph.57.030195.000315. - DOI - PubMed
    1. Sinensky M. Homeoviscous Adaptation—A Homeostatic Process That Regulates the Viscosity of Membrane Lipids in Escherichia coli. Proc. Natl. Acad. Sci. USA. 1974;71:522–525. doi: 10.1073/pnas.71.2.522. - DOI - PMC - PubMed
    1. Jebbar M., Franzetti B., Girard E., Oger P. Microbial Diversity and Adaptation to High Hydrostatic Pressure in Deep-Sea Hydrothermal Vents Prokaryotes. Extremophiles. 2015;19:721–740. doi: 10.1007/s00792-015-0760-3. - DOI - PubMed

LinkOut - more resources