. 2025 Mar 26;26(7):3037.
doi: 10.3390/ijms26073037.

Urolithin A Protects Porcine Oocytes from Artificially Induced Oxidative Stress Damage to Enhance Oocyte Maturation and Subsequent Embryo Development

Affiliations

Urolithin A Protects Porcine Oocytes from Artificially Induced Oxidative Stress Damage to Enhance Oocyte Maturation and Subsequent Embryo Development

Wen Shi et al. Int J Mol Sci. .

Abstract

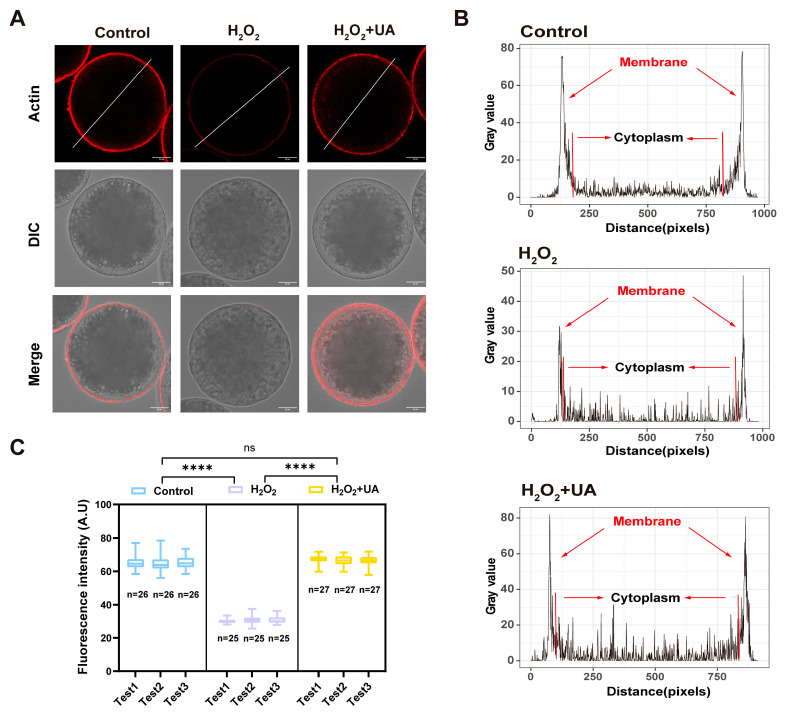
Both the livestock and biomedical fields require a large supply of high-quality mature oocytes. However, the in vitro maturation (IVM) process often leads to an accumulation of reactive oxygen species (ROS), which can cause defects in oocyte meiosis and embryo development, ultimately compromising oocyte quality. Urolithin A (UA), known for its antioxidant properties, has not been thoroughly investigated for its potential to mitigate the negative effects of oxidative stress during the in vitro culturing of oocytes, and its underlying mechanism is not well understood. In this study, an in vitro oxidative stress model was established using porcine oocytes treated with H2O2, followed by exposure to varying concentrations of UA. The results revealed that 30 μM UA significantly improved both the quality of oocyte culture and the developmental potential of the resulting embryos. UA was found to enhance oocyte autophagy, reduce oxidative stress-induced mitochondrial damage, and restore mitochondrial function. Additionally, it lowered ROS and DNA damage levels in the oocytes, maintained proper spindle/chromosome alignment and actin cytoskeleton structure, promoted nuclear maturation, prevented abnormal cortical granule distribution, and supported oocyte cytoplasmic maturation. As a result, UA alleviated oxidative stress-induced defects in oocyte maturation and cumulus cell expansion, thereby improving the developmental potential and quality of parthenogenetic embryos. After supplementation with UA, pig parthenogenetic embryo pluripotency-related genes (Nanog and Sox2) and antiapoptotic genes (Bcl2) were upregulated, while proapoptotic genes (Bax) were downregulated. In conclusion, this study suggests that adding UA during IVM can effectively mitigate the adverse effects of oxidative stress on porcine oocytes, presenting a promising strategy for enhancing their developmental potential in vitro.

Keywords: autophagy; embryo development; meiotic maturation; mitochondrial function; oocyte quality; oxidative stress; urolithin A.


Conflict of interest statement

The authors state that they have no potential conflicts of interest.

Figures

Figure 1
Figure 1
Effects of different concentrations of H2O2 on porcine oocyte maturation and parthenogenetic embryo developmental competence. (A) Illustrative examples demonstrating the cumulus expansion scoring system in porcine cumulus oocyte complexes (COCs). Scale bar, 400 µm. (B) Statistics of cumulus expansion after COCs were treated with different concentrations of H2O2. Control group n = 265, 50 μM group n = 299, 100 μM group n = 275, 200 μM group n = 288, 400 μM group n = 259. (C) Representative images of the control group and different concentrations H2O2-treated groups after in vitro maturation (IVM). Scale bar, 1000 µm (a–e); 200 µm (f–j); 25 µm (k–o). (D) The rate of the first polar body extrusion (PBE) was recorded in the control group and different concentrations of H2O2-treated groups. Control group n = 201, 50 μM group n = 211, 100 μM group n = 224, 200 μM group n = 225, 400 μM group n = 213. (E) The statistics of the cleavage rate recorded in the control group and different concentrations of H2O2-treated groups. Control group n = 238, 50 μM group n = 245, 100 μM group n = 241, 200 μM group n = 242, 400 μM group n = 253. (F) The rate of the blastocyst (BL) formation was recorded in the control group and different concentrations of H2O2-treated groups. Control group n = 238, 50 μM group n = 245, 100 μM group n = 241, 200 μM group n = 242, 400 μM group n = 253. Data in (B,D,E,F) are presented as the mean ± SEM of at least three independent experiments. * p  <  0.05, *** p  <  0.001, **** p  <  0.0001. The number of cells used for analysis was equal to the summation of cells used in each test.
Figure 2
Figure 2
Effects of different doses of urolithin A (UA) supplement on porcine conventional oocyte IVM and parthenogenetic embryo developmental competence. (A) The rate of the first PBE of porcine conventional oocyte IVM was recorded in the control group and different concentrations of UA-treated groups. Control group n = 178, 5 μM group n = 179, 10 μM group n = 152, 20 μM group n = 150, 40 μM group n = 168, 80 μM group n = 178, 160 μM group n = 153. (B) The statistics of the cleavage rate recorded in the control group and different concentrations of UA-treated groups. Control group n = 178, 5 μM group n = 179, 10 μM group n = 152, 20 μM group n = 150, 40 μM group n = 168, 80 μM group n = 178, 160 μM group n = 153. (C) The rate of the BL formation was recorded in the control group and different concentrations of UA-treated groups. Control group n = 178, 5 μM group n = 179, 10 μM group n = 152, 20 μM group n = 150, 40 μM group n = 168, 80 μM group n = 178, 160 μM group n = 153. Data in (AC) are presented as the mean ± SEM of at least three independent experiments. ns, no significance, * p  <  0.05, ** p  <  0.01, *** p  <  0.001. The number of cells used for analysis was equal to the summation of cells used in each test.
Figure 3
Figure 3
Effects of different concentrations of UA supplementation on porcine oocyte maturation and parthenogenetic embryo developmental competence. (A) Representative images of the control group and different concentrations UA supplementation after in vitro maturation (IVM). Scale bar, 200 µm (a–h,m–t); 25 µm (i–l,u–x). (B) Statistics of cumulus expansion after COCs were treated with different concentrations of UA. Control group n = 253, 0 μM group n = 285, 5 μM group n = 233, 10 μM group n = 245, 15 μM group n = 251, 30 μM group n = 233, 60 μM group n = 233, 120 μM group n = 223. (C) The rate of the first PBE was recorded in the control group and different concentrations of UA supplementation groups. Control group n = 246, 0 μM group n = 274, 5 μM group n = 179, 10 μM group n = 173, 15 μM group n = 184, 30 μM group n = 281, 60 μM group n = 243, 120 μM group n = 194. (D) The statistics of the cleavage rate recorded in the control group and different concentrations of UA supplementation groups. Control group n = 246, 0 μM group n = 274, 5 μM group n = 179, 10 μM group n = 173, 15 μM group n = 184, 30 μM group n = 227, 60 μM group n = 243, 120 μM group n = 163. (E) The rate of the blastocyst formation was recorded in the control group and different concentrations of UA supplementation groups. Control group n = 246, 0 μM group n = 274, 5 μM group n = 179, 10 μM group n = 173, 15 μM group n = 184, 30 μM group n = 227, 60 μM group n = 243, 120 μM group n = 163. Data in (BE) are presented as the mean ± SEM of at least three independent experiments. * p  <  0.05, ** p  <  0.01, *** p  <  0.001, **** p  <  0.0001. The number of cells used for analysis was equal to the summation of cells used in each test.
Figure 4
Figure 4
Antioxidant effect of UA on artificially induced oxidative stress-damaged porcine oocytes during IVM. (A) Representative images of the control group, H2O2-treated, and UA-supplemented oocytes stained with DCFHDA. Scale bar, 200 µm. (B) The fluorescence intensity of ROS signals was measured in the control group, H2O2-treated, and UA-supplemented oocytes. Control group n = 96, H2O2-treated group n = 96, H2O2+UA group n = 97. (C) Relative expression of genes related to antioxidant effects. Data are the mean ± SEM values. Each experiment was independently repeated at least three times. Data in (B,C) are presented as the mean ± SEM of at least three independent experiments. ns, no significance, * p  <  0.05, ** p  <  0.01, *** p  <  0.001, **** p  <  0.0001.
Figure 5
Figure 5
Effect of UA supplementation on DNA damage in artificially induced oxidative stress-damaged Porcine oocytes during IVM. (A) Representative images of DNA damage stained with the γ-H2AX antibody in the control group, H2O2-treated and UA-supplemented oocytes. Scale bar, 10 μm. (B) The fluorescence intensity of γ-H2A.X signals were measured in the control group, H2O2-treated and UA-supplemented oocytes. Control group n = 60, H2O2-treated group n = 68, H2O2+UA group n = 62. Data in (B) are presented as the mean ± SEM of at least three independent experiments. *** p  <  0.0001; **** p  <  0.0001.
Figure 6
Figure 6
Effect of UA Supplementation on spindle and chromosome structure in artificially induced oxidative stress-damaged porcine oocytes during IVM. (A) Representative images of normal and abnormal spindle morphology and chromosome alignment at metaphase II. Scale bar, 5 μm. (B) Representative images of the spindle morphology and chromosome alignment at metaphase II in the control group, H2O2-treated, and UA-supplemented oocytes. Scale bar, 5 μm. (C) The rate of aberrant spindles at metaphase II was recorded in the control group, H2O2-treated, and UA-supplemented oocytes. Control group n = 100, H2O2-treated group n = 105, H2O2+UA group n = 110. (D) The rate of misaligned chromosomes at metaphase II was recorded in the control group, H2O2-treated, and UA-supplemented oocytes. Control group n = 100, H2O2-treated group n = 105, H2O2+UA n = 110 group. Data in (C,D) are presented as the mean ± SEM of at least three independent experiments. * p  <  0.05, ** p  <  0.01, *** p  <  0.001.
Figure 7
Figure 7
Effect of UA supplementation on actin cytoskeleton dynamics in artificially induced oxidative stress-damaged porcine oocytes during IVM. (A) Fluorescence images of actin cytoskeleton signals at metaphase II in the control group, H2O2-treated, and UA-supplemented oocytes. Scale bar, 20 μm. (B) The fluorescence intensity profiling of actin in the control group, H2O2-treated, and UA-supplemented oocytes. (C) The fluorescence intensity of actin on the plasma membrane was measured in the control group, H2O2-treated, and UA-supplemented oocytes. Control group n = 78, H2O2-treated group n = 75 and H2O2+UA group n = 81. Data in (C) are presented as the mean ± SEM of at least three independent experiments. ns, no significance, **** p  <  0.001.
Figure 8
Figure 8
Effect of UA supplementation on mitochondrial function in artificially induced oxidative stress-damaged porcine oocytes during IVM. (A) Representative images of mitochondria in the control group, H2O2-treated, and UA-supplemented oocytes. Scale bar, 200 µm. (B) The fluorescence intensity of MitoTracker signals was recorded in the control group, H2O2-treated, and UA-supplemented oocytes. Control group n = 90, H2O2-treated group n = 96, H2O2+UA group n = 98. (C) ATP levels were measured in the control group, H2O2-treated, and UA-supplemented oocytes. Control group n = 60, H2O2-treated group n = 60, H2O2+UA group n = 60. (D) Mitochondrial membrane potential was detected by JC-1 staining in the control group (n = 25), H2O2-treated (n = 25), and UA-supplemented (n = 24) oocytes. Scale bar, 200 μm. (E) The ratio of red to green fluorescence intensity was calculated in the control group, H2O2-treated, and UA-supplemented oocytes. Control group n = 75, H2O2-treated group n = 75, H2O2+UA group n = 75. (F) Relative expression of genes related to mitochondrial function. (G) Relative expression of genes related to autophagy. Data in (B,C,EG) are presented as the mean ± SEM of at least three independent experiments. ns, no significance, * p  <  0.05, ** p  <  0.01, *** p  <  0.001, **** p  <  0.0001.
Figure 9
Figure 9
Effect of UA supplementation on the dynamics of CGs in artificially induced oxidative stress-damaged porcine oocytes during IVM. (A) Representative images of CG distribution in the control group, H2O2-treated, and UA-supplemented oocytes. Scale bar, 25 µm. (B) The fluorescence intensity of CGs signals was measured in the control group, H2O2-treated, and UA-supplemented oocytes. Control group n = 60, H2O2-treated group n = 60, H2O2+UA group n = 60. Data in (B) are presented as the mean percentage (mean ± SEM) of at least three independent experiments. **** p  <  0.0001.
Figure 10
Figure 10
Effect of UA supplementation on the developmental quality of parthenogenetic embryos. (A) Representative images of blastocysts (scale bar, 200 µm) and Hoechst stain in blastocysts (scale bar, 25 µm) from the control group (n = 25), H2O2-treated (n = 25), and UA-supplemented (n = 25). (B) Statistics of total cell number per blastocyst in the control group, H2O2-treated, and UA-supplemented oocytes. Control group n = 75, H2O2-treated group n = 75, H2O2+UA group n = 75. (C) Relative expression of genes related to pluripotency. Data are the mean ± SEM values. (D) Relative expression of genes related to apoptosis. Data are the mean ± SEM values. Data in (BD) are presented as the mean ± SEM of at least three independent experiments. ns, no significance, ** p  <  0.01, *** p  <  0.001, **** p  <  0.0001.

Similar articles

References

    1. Lunney J.K. Advances in Swine Biomedical Model Genomics. Int. J. Biol. Sci. 2007;3:179–184. doi: 10.7150/ijbs.3.179. - DOI - PMC - PubMed
    1. Aigner B., Renner S., Kessler B., Klymiuk N., Kurome M., Wünsch A., Wolf E. Transgenic Pigs as Models for Translational Biomedical Research. J. Mol. Med. 2010;88:653–664. doi: 10.1007/s00109-010-0610-9. - DOI - PubMed
    1. Abeydeera L.R. In Vitro Production of Embryos in Swine. Theriogenology. 2002;57:256–273. doi: 10.1016/s0093-691x(01)00670-7. - DOI - PubMed
    1. Fang X., Xia W., Li S., Qi Y., Liu M., Yu Y., Li H., Li M., Tao C., Wang Z., et al. SIRT2 Is Critical for Sheep Oocyte Maturation through Regulating Function of Surrounding Granulosa Cells. Int. J. Mol. Sci. 2022;23:5013. doi: 10.3390/ijms23095013. - DOI - PMC - PubMed
    1. Wang Y., Qi J.-J., Yin Y.-J., Jiang H., Zhang J.-B., Liang S., Yuan B. Ferulic Acid Enhances Oocyte Maturation and the Subsequent Development of Bovine Oocytes. Int. J. Mol. Sci. 2023;24:14804. doi: 10.3390/ijms241914804. - DOI - PMC - PubMed

LinkOut - more resources