. 2025 Mar 28;26(7):3109.
doi: 10.3390/ijms26073109.

Analysis of Metabolomic Reprogramming Induced by Infection with Kaposi's Sarcoma-Associated Herpesvirus Using Untargeted Metabolomic Profiling

Affiliations

Analysis of Metabolomic Reprogramming Induced by Infection with Kaposi's Sarcoma-Associated Herpesvirus Using Untargeted Metabolomic Profiling

Abdulkarim Alfaez et al. Int J Mol Sci. .

Abstract

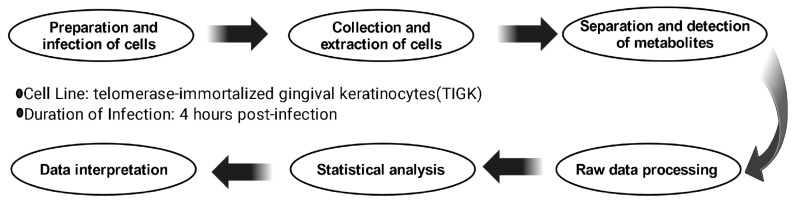
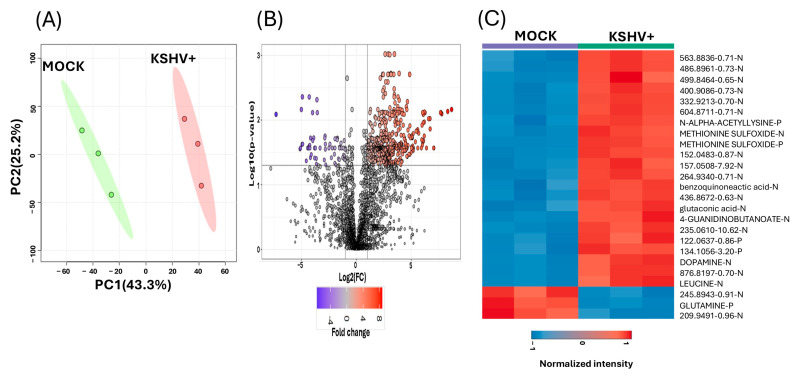
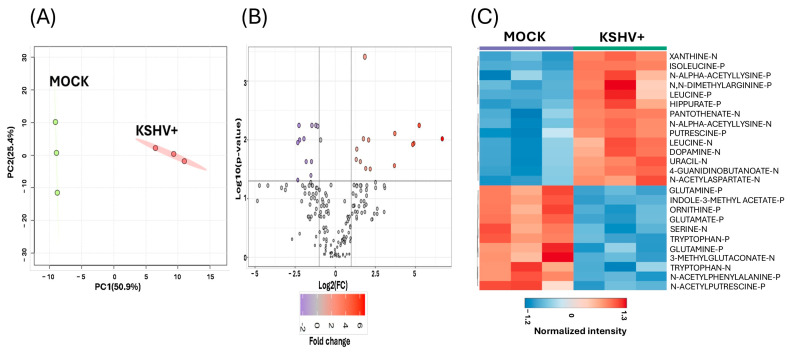
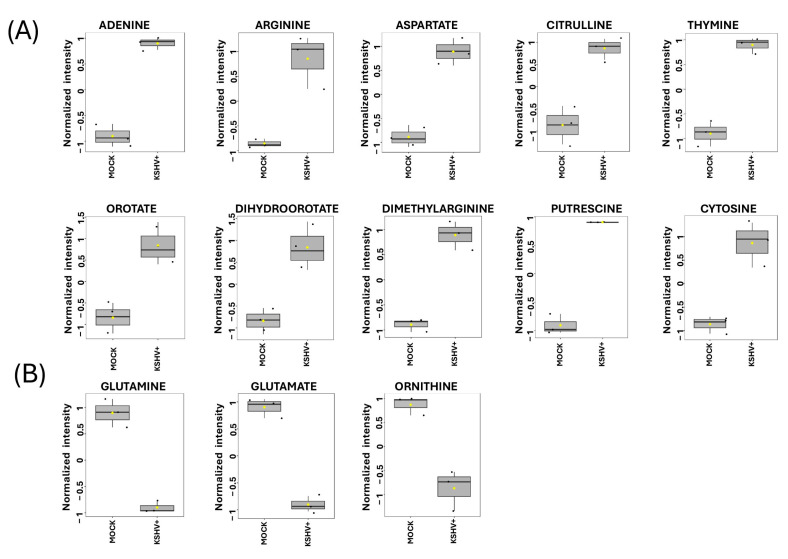
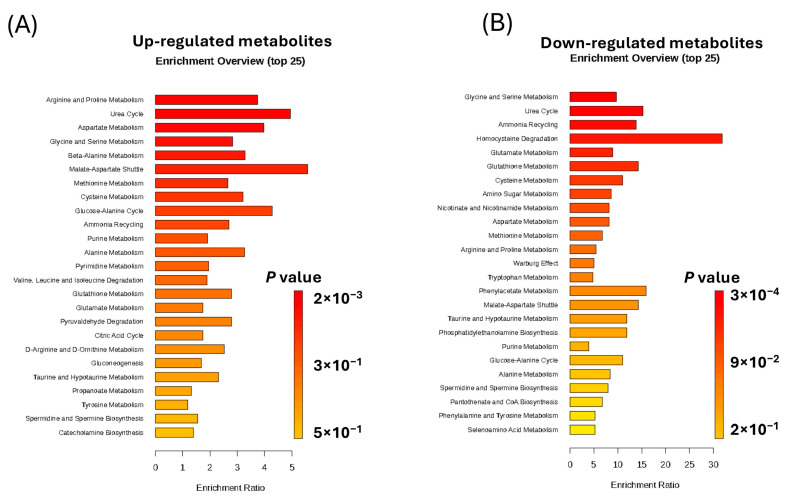
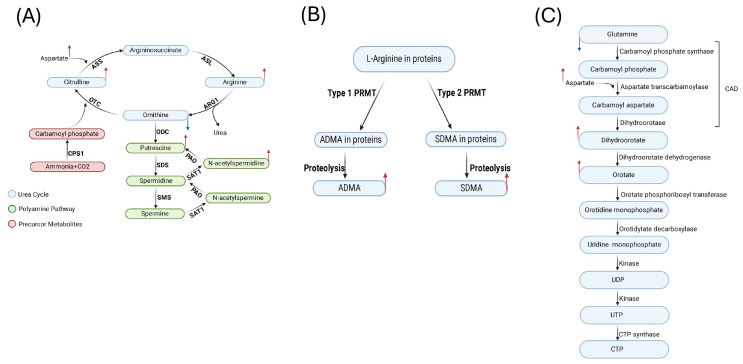
Kaposi's sarcoma-associated herpesvirus (KSHV) is an oncogenic double-stranded DNA virus. There are no vaccines or antiviral therapies for KSHV. Identifying the cellular metabolic pathways that KSHV manipulates can broaden the knowledge of how these pathways contribute to sustaining lytic infection, which can be targeted in future therapies to prevent viral spread. In this study, we performed an untargeted metabolomic analysis of KSHV infected telomerase-immortalized gingival keratinocytes (TIGK) cells at 4 h post-infection compared to mock-infected cells. We found that the metabolomic landscape of KSHV-infected TIGK differed from that of the mock. Specifically, a total of 804 differential metabolic features were detected in the two groups, with 741 metabolites that were significantly upregulated, and 63 that were significantly downregulated in KSHV-infected TIGK cells. The differential metabolites included ornithine, arginine, putrescine, dimethylarginine, orotate, glutamate, and glutamine, and were associated with pathways, such as the urea cycle, polyamine synthesis, dimethylarginine synthesis, and de novo pyrimidine synthesis. Overall, our untargeted metabolomics analysis revealed that KSHV infection results in marked rapid alterations in the metabolic profile of the oral epithelial cells. We envision that a subset of these rapid metabolic changes might result in altered cellular functions that can promote viral lytic replication and transmission in the oral cavity.

Keywords: KSHV; de novo infection; metabolomics; oral epithelial cells.


Conflict of interest statement

The authors declare no conflicts of interest relevant to this study.

Figures

Figure 1
Figure 1
Schematic summary of the applied untargeted metabolomics workflow.
Figure 2
Figure 2
Metabolites profile of KSHV-infected cells and mock cells. (A) Two-dimensional principal component analysis score plot compares the metabolomic profile of KSHV-infected cells to mock cells. In the plot, green represents mock cells and red represents KSHV-infected cells. (B) Volcano plot illustrates the metabolomic profile of KSHV-infected cells compared to mock cells. In this plot, the red circle represents the significantly upregulated metabolites in KSHV-infected cells, and the purple circle represents the significantly downregulated metabolites. (C) Hierarchical clustering heat map displays the metabolic abundance in KSHV-infected cells compared to mock cells. Red color represents the significantly upregulated metabolites, and the blue color represents the significantly downregulated metabolites. All analyses were conducted for metabolites with a fold change ≥ 2 and a p value < 0.05 (FDR). Both Level 1 and Level 3 metabolites were utilized to generate Figure 2. In (C), Level 1 is indicated with uppercase letters, while Level 3 is indicated with lowercase letters.
Figure 3
Figure 3
Profile of KSHV infected cell and mock cells showing only identified metabolites. (A) 2D-principal component analysis score plot compares the metabolomic profile of KSHV-infected cells to mock cells. In the plot, green represents mock cells and red represents KSHV-infected cells. (B) A volcano plot illustrates the metabolomic profile of KSHV-infected cells compared to mock cells. The red circle represents significantly upregulated metabolites in KSHV-infected cells, and the purple circle represents significantly downregulated metabolites. (C) The hierarchical clustering heat map displays the metabolic abundance in KSHV-infected cells compared to mock cells. In this heat map, the red color represents significantly upregulated metabolites, and the blue color represents significantly downregulated metabolites All analyses were conducted for metabolites with a fold change ≥ 2 and a p value < 0.05 (FDR). Only level 1 metabolites were utilized to generate (AC).
Figure 4
Figure 4
Significant metabolites of KSHV-infected cells. Box plots illustrate the relative signal intensity levels of discriminant metabolites between KSHV-infected cells and mock cells. Metabolites that are significantly upregulated (A) or downregulated (B) in KSHV-infected cells. The black dots within the plot denote the metabolite levels in the three biological replicates, while the yellow diamond signifies the average value for the group, as denoted on the y-axis. This figure displays level 1 metabolites.
Figure 5
Figure 5
Metabolic enrichment analysis. The enrichment analysis was conducted for the significantly upregulated metabolites in KSHV-infected cells (A) and the significantly downregulated metabolites in KSHV-infected cells (B) using the Small Molecules Pathway Database (SMPD). The analysis was performed for metabolites with a fold change ≥ 2 and a p value < 0.05 (FDR). These figures were generated with both level 1 and 3 metabolites.
Figure 6
Figure 6
Schematic overview of selected affected pathways in KSHV-infected cells. (A) Urea cycle and polyamine pathways; (B) ADMA and SDMA pathway; and (C) de novo pyrimidine synthesis. The metabolites highlighted with a red arrow indicate upregulated metabolites, while those highlighted with a blue arrow indicate downregulated metabolites. This figure displays level 1 metabolites.

Similar articles

References

    1. Bardanzellu F., Fanos V. How could metabolomics change pediatric health? Ital. J. Pediatr. 2020;46:37. doi: 10.1186/s13052-020-0807-7. - DOI - PMC - PubMed
    1. Aretz I., Meierhofer D. Advantages and Pitfalls of Mass Spectrometry Based Metabolome Profiling in Systems Biology. Int. J. Mol. Sci. 2016;17:632. doi: 10.3390/ijms17050632. - DOI - PMC - PubMed
    1. Rinschen M.M., Ivanisevic J., Giera M., Siuzdak G. Identification of bioactive metabolites using activity metabolomics. Nat. Rev. Mol. Cell Biol. 2019;20:353–367. doi: 10.1038/s41580-019-0108-4. - DOI - PMC - PubMed
    1. Bray F., Ferlay J., Soerjomataram I., Siegel R.L., Torre L.A., Jemal A. Global cancer statistics 2018: GLOBOCAN estimates of incidence and mortality worldwide for 36 cancers in 185 countries. CA Cancer J. Clin. 2018;68:394–424. doi: 10.3322/caac.21492. - DOI - PubMed
    1. Iftode N., Rădulescu M.A., Aramă Ș.S., Aramă V. Update on Kaposi sarcoma-associated herpesvirus (KSHV or HHV8)—Review. Rom. J. Intern. Med. 2020;58:199–208. doi: 10.2478/rjim-2020-0017. - DOI - PubMed

LinkOut - more resources