

Harnessing the Role of ESR1 in Breast Cancer: Correlation with microRNA, lncRNA, and Methylation
- PMID: 40243758
- PMCID: PMC11988918
- DOI: 10.3390/ijms26073101
Harnessing the Role of ESR1 in Breast Cancer: Correlation with microRNA, lncRNA, and Methylation
Abstract
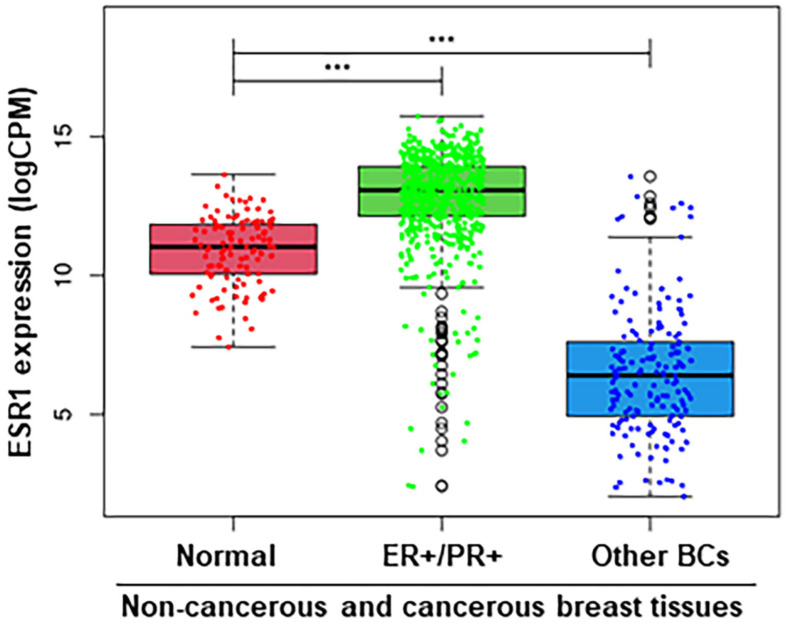
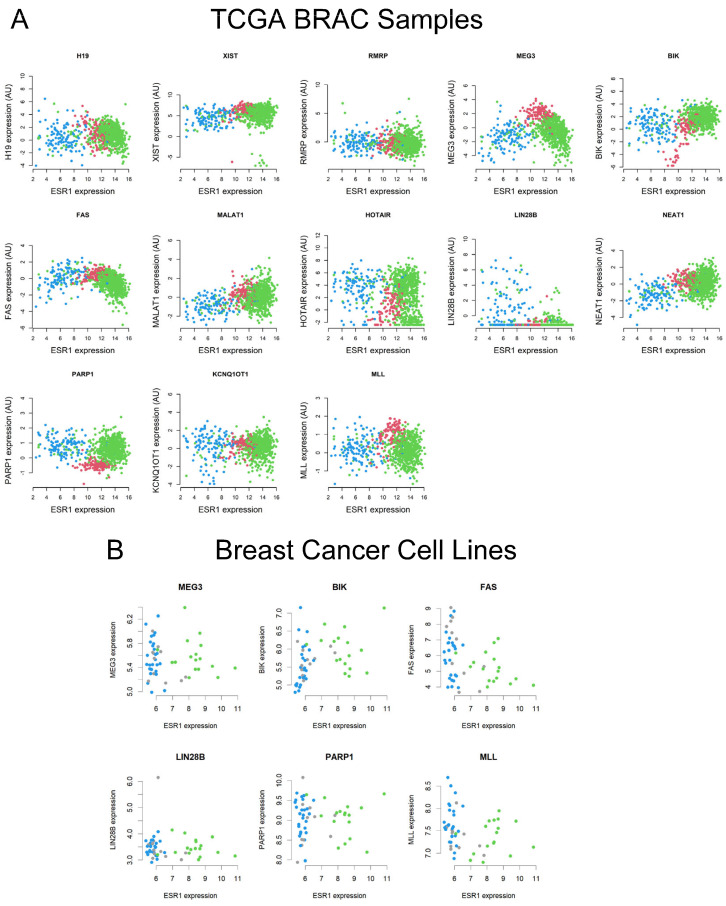
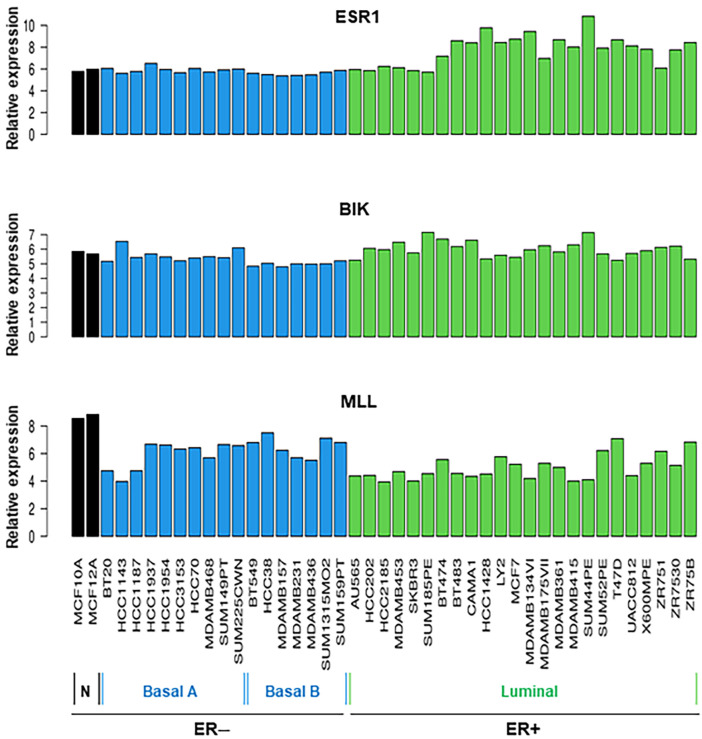
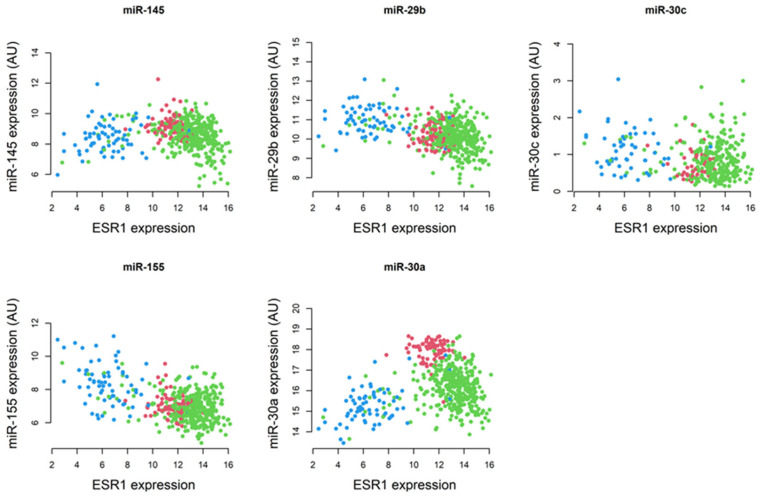
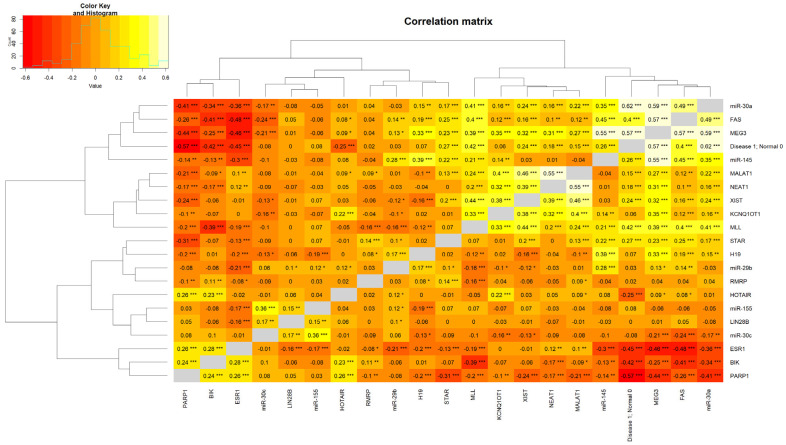
Breast cancer (BC) is a multifactorial condition and it primarily expresses the estrogen receptor α (ERα) that is encoded by the gene estrogen receptor 1 (ESR1), which modulates estrogen signaling. ESR1, by facilitating estrogen overproduction, plays an indispensable role in the progression and survival of the majority of BCs. To obtain molecular insights into these phenomena, we analyzed The Cancer Genome Atlas (TCGA) breast invasive carcinoma (BRCA) RNA-Seq datasets for the expression of ESR1 and its correlation to microRNAs (miRNAs) and long non-coding RNAs (lncRNAs), along with its methylation patterns. Regulation of ESR1 was also assessed with a total of 43 cancerous and non-cancerous breast cell lines. Analyses of both TCGA BRCA and breast cell line RNA-Seq data revealed that specific lncRNAs, i.e., MEG3, BIK, MLL, and FAS are negatively correlated with the ESR1, in which PARP1 demonstrates a positive association. Additionally, both miR-30a and miR-145 showed negative correlations with the ESR1 expression. Of the 54 ESR1 methylation loci analyzed, the majority of them exhibited a negative correlation with the ESR1 expression, highlighting a potentially modifiable regulatory mechanism. These findings underscore the complex regulatory events influencing ESR1 expression and its interaction with diverse signaling pathways, demonstrating novel insights into breast pathogenesis and its potential therapeutics.
Keywords: ESR1; breast cancer; gene expression; lncRNA; methylation; microRNA.
Conflict of interest statement
The authors declare that there are no competing interests that could be perceived as prejudicing the impartiality of this work. The funders had no role in the design of the study; in the collection, analyses, or interpretation of data; in the writing of the manuscript; or in the decision to publish the results.
Figures
Similar articles
-
Analysis of the miRNA-mRNA-lncRNA networks in ER+ and ER- breast cancer cell lines.J Cell Mol Med. 2015 Dec;19(12):2874-87. doi: 10.1111/jcmm.12681. Epub 2015 Sep 28. J Cell Mol Med. 2015. PMID: 26416600 Free PMC article.
-
MiR-301a-3p Suppresses Estrogen Signaling by Directly Inhibiting ESR1 in ERα Positive Breast Cancer.Cell Physiol Biochem. 2018;46(6):2601-2615. doi: 10.1159/000489687. Epub 2018 May 7. Cell Physiol Biochem. 2018. PMID: 29763890
-
Transcriptional implications of intragenic DNA methylation in the oestrogen receptor alpha gene in breast cancer cells and tissues.BMC Cancer. 2015 May 1;15:337. doi: 10.1186/s12885-015-1335-5. BMC Cancer. 2015. PMID: 25927974 Free PMC article.
-
Micro-RNAs targeting the estrogen receptor alpha involved in endocrine therapy resistance in breast cancer.Biochim Biophys Acta Mol Basis Dis. 2025 Jun;1871(5):167783. doi: 10.1016/j.bbadis.2025.167783. Epub 2025 Mar 6. Biochim Biophys Acta Mol Basis Dis. 2025. PMID: 40057206 Review.
-
MicroRNA-205-5p inhibits the growth and migration of breast cancer through targeting Wnt/β-catenin co-receptor LRP6 and interacting with lncRNAs.Mol Cell Biochem. 2025 Apr;480(4):2117-2129. doi: 10.1007/s11010-024-05136-4. Epub 2024 Oct 26. Mol Cell Biochem. 2025. PMID: 39461917 Review.
References
MeSH terms
Substances
Grants and funding
LinkOut - more resources
Full Text Sources
Medical
Research Materials
Miscellaneous
