. 2025 Aug;48(8):5802-5818.
doi: 10.1111/pce.15562. Epub 2025 Apr 17.

Plant Morphology and a Phytochrome B Model Reveal That the Effects of Far-Red Light on Shade-Avoidance-Like Responses Persist Under High Light Intensity

Affiliations

Plant Morphology and a Phytochrome B Model Reveal That the Effects of Far-Red Light on Shade-Avoidance-Like Responses Persist Under High Light Intensity

Jiyong Shin et al. Plant Cell Environ. 2025 Aug.

Abstract

Several studies have concluded that high photon flux density (PFD) attenuates the effects of the red (R; 600-699 nm) to far-red (FR; 700-750 nm) light ratio on morphology. However, the suppressive effects can depend on individual wavebands that modulate photoreceptor activity. We postulated that morphological responses of shade-avoiding plants to the FR fraction (FR-PFD divided by R + FR PFD) act independent of total PFD (TPFD; 400-750 nm) when TPFD increases are only from R and FR light. We grew kale and lettuce under three FR fractions and four TPFDs while maintaining a constant blue (B; 400-499 nm) PFD. An increase in the R + FR PFD reduced leaf elongation and specific leaf area (SLA). However, higher light did not suppress the FR-fraction effects on leaf elongation and SLA. We estimated PHYB activity with a three-state PHYB model to mechanistically explain the suppressive effects of high light on leaf elongation and SLA but not on FR-mediated leaf elongation and SLA increase. PHYB model predictions were in accordance with the morphological responses of kale and lettuce. This study is the first to apply the three-state PHYB model to explain photon-spectrum-induced morphology of light-grown whole plants, demonstrating its potential use to crops and for applications.

Keywords: Brassica; Lactuca; acclimation; morphogenesis; phytochrome B; vegetables.


Figures

Figure 1
Figure 1
Average spectral distributions of twelve lighting treatments with three different levels of far‐red fraction and four different sums of red (600–699 nm) and far‐red (700–750 nm) photon flux densities (R + FR PFD; A–D) delivered by blue (peak at 447 nm), red (peak at 660 nm), and far‐red (peak at 733 nm) light‐emitting diodes.
Figure 2
Figure 2
Visual representation of twelve lighting treatments with three different levels of far‐red fraction and four different sums of red (R; 600–699 nm) and far‐red (FR; 700–750 nm) photon flux densities (PFD; in µmol∙m−2 ∙ s−1) delivered by blue (peak at 447 nm), R (peak at 660 nm), and FR (peak at 733 nm) light‐emitting diodes. The value following B, R, and FR indicates measured average blue (B; 400–499 nm), R, and FR PFD in µmol∙m−2 ∙ s−1, respectively. [Color figure can be viewed at wileyonlinelibrary.com]
Figure 3
Figure 3
Average spectral distributions of six lighting treatments with three different levels of far‐red fraction and two different total photon flux densities (TPFD; 400–750 nm; A, B) delivered by blue (peak at 445 nm), red (peak at 660 nm), and far‐red (peak at 736 nm) light‐emitting diodes. Blue photon flux density (B‐PFD; 400–499 nm) was proportionally changed with TPFD (35%). [Color figure can be viewed at wileyonlinelibrary.com]
Figure 4
Figure 4
Representative photographs taken 16, 17, or 18 days after seed sow of kale ‘Red Russian’, lettuce ‘Rex’, and lettuce ‘Rouxai’, respectively. Plants were grown under twelve lighting treatments. Far‐red fraction refers to the fraction of the far‐red (FR; 700–750 nm) photon flux density (PFD) relative to the sum of the red (R; 600–699 nm) and FR PFD. The red + far‐red photon flux density refers to the photon flux integral between 600 nm and 750 nm, in µmol∙m−2 ∙ s−1. All plants received a PFD of blue light at 50 µmol∙m−2 ∙ s−1. The bar on the right‐top corner applies to all images. [Color figure can be viewed at wileyonlinelibrary.com]
Figure 5
Figure 5
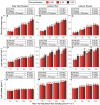
Influence of twelve lighting treatments on the leaf‐shape index (the ratio of leaf length to leaf width) and specific leaf area of the largest leaf of kale ‘Red Russian’ and lettuce ‘Rex’ and ‘Rouxai’. Far‐red fraction (FR fraction) refers to the fraction of the far‐red (FR; 700–750 nm) photon flux density (PFD) relative to the sum of the red (R; 600–699 nm) and FR PFD. R + FR PFD refers to the photon flux integral between 600 nm and 750 nm, in µmol∙m−2 ∙ s−1. Absolute values (A, B, C, G, H, I) were normalized to the average value at the lowest FR fraction for each R + FR PFD (D, E, F, J, K, L). DM refers to dry mass. Means with different letters are significantly different based on Tukey's HSD test (p < 0.05), except for kale specific leaf area, which was evaluated using Tukey‐Kramer test because of an unbalanced data set. Error bars represent standard error for n = 3 replicates unless marked with *, where standard error is based on n = 2 replicates due to outlier removal. The p values in the tables indicate the significance of the main and interaction effects based on type Ⅲ two‐way analysis of variance test. [Color figure can be viewed at wileyonlinelibrary.com]
Figure 6
Figure 6
Influence of twelve lighting treatments on the shoot dry mass (A, B, C), leaf area of the largest leaf (D, E, F), and leaf number per plant (G, H, I) of kale ‘Red Russian’ and lettuce ‘Rex’ and ‘Rouxai’. Far‐red fraction (FR fraction) refers to the fraction of the far‐red (FR; 700–750 nm) photon flux density (PFD) relative to the sum of the red (R; 600–699 nm) and FR PFD. Means with different letters are significantly different based on Tukey's HSD test (p < 0.05), except for the leaf number of lettuce ‘Rex’, which was evaluated using Tukey‐Kramer test because of an unbalanced data set. Error bars represent standard error for n = 3 replicates unless marked with *, where standard error is based on n = 2 replicates due to outlier removal. The p values in the tables indicate the significance of the main and interaction effects based on type Ⅲ two‐way analysis of variance test. [Color figure can be viewed at wileyonlinelibrary.com]
Figure 7
Figure 7
Sensitivity analysis of the three‐state phytochrome B model developed for Arabidopsis (Klose et al. ; Smith and Fleck 2019), which estimates the proportion of active phytochrome B dimer (D2/Dtot) under simulated red (R; 660 nm) and far‐red (FR; 730 nm) light. The FR fraction refers to the fraction of the FR photon flux density (PFD) relative to the sum of the R and FR PFD (R + FR PFD; in µmol∙m−2 ∙ s−1). In the simulations, 24°C was used in sensitivity to the FR fraction and R + FR PFD (A, D); an R + FR PFD of 290 µmol∙m−2 ∙ s−1 was used in the FR fraction and temperature (B, E) sensitivity; and an FR fraction of zero was used in the R + FR PFD and temperature (C, F) sensitivity. The R + FR PFD, the FR fraction, or the temperature in each subfigure indicates stable conditions. [Color figure can be viewed at wileyonlinelibrary.com]
Figure 8
Figure 8
The estimated proportion of active phytochrome B dimer (D2/Dtot; Klose et al. ; Smith and Fleck 2019) at three levels of far‐red fraction (A) and the effect of a high far‐red fraction in decreasing the D2/Dtot relative to the lowest far‐red fraction (B) at four different red + far‐red photon flux densities (PFDs). Far‐red fraction (FR fraction) refers to the fraction of the far‐red (FR; 700–750 nm) PFD relative to the sum of the red (R; 600–699 nm) and far‐red PFD. Data points and error bars represent the mean and standard error of D2/Dtot, estimated using actual photon spectra measured at each of the three experimental replications (n = 3). Means with different letters are significantly different based on Tukey's HSD test (p < 0.05). The p values in the tables indicate the significance of the main and interaction effects based on type Ⅲ two‐way analysis of variance test. [Color figure can be viewed at wileyonlinelibrary.com]
Figure 9
Figure 9
The estimated proportion of active phytochrome B dimer (D2/Dtot; Klose et al. ; Smith and Fleck 2019) at three levels of far‐red fraction with (closed symbol and solid line) and without (open symbol and dashed line) thermal reversion (A) or background blue light (B) at four different red + far‐red photon flux densities (PFDs). Far‐red fraction (FR fraction) refers to the fraction of the far‐red (FR; 700–750 nm) PFD relative to the sum of the red (R; 600–699 nm) and far‐red PFD. Data points and error bars represent the mean and standard error of D2/Dtot, estimated using actual photon spectra measured at each of the three experimental replications (n = 3). Means with different letters are significantly different based on Tukey's HSD test (p < 0.05). [Color figure can be viewed at wileyonlinelibrary.com]
Figure 10
Figure 10
Influence of six lighting treatments on the leaf‐shape index (the ratio of leaf length to leaf width; A, B, C) and specific leaf area (D, E, F) of the largest leaf of kale ‘Red Russian’ and lettuce ‘Rex’ and ‘Rouxai’. Far‐red fraction (FR fraction) refers to the fraction of the far‐red (FR; 700–750 nm) photon flux density relative to the sum of the red (R; 600–699 nm) and far‐red photon flux density. The total photon flux density (TPFD) refers to the photon flux integral between 400 and 750 nm, in µmol∙m−2 ∙ s−1. The fraction of blue (400–499 nm) photon flux density to TPFD was identical at both TPFDs (35%). DM refers to dry mass. Means with different letters are significantly different based on Tukey's HSD test (p < 0.05). Error bars represent standard error for n = 2 replicates. The p values in the tables indicate the significance of the main and interaction effects based on type Ⅲ two‐way analysis of variance test. [Color figure can be viewed at wileyonlinelibrary.com]
Figure 11
Figure 11
Influence of the estimated phytochrome B dimer activity (D2/Dtot; Klose et al. ; Smith and Fleck 2019) of twelve lighting treatments on the leaf‐shape index (the ratio of leaf length to leaf width) and specific leaf area of kale ‘Red Russian’ and lettuce ‘Rex’ and ‘Rouxai’. The far‐red fraction refers to the fraction of the far‐red (FR; 700–750 nm) photon flux density (PFD, in µmol∙m−2 ∙ s−1) to the sum of red (R; 600–699 nm) and FR PFD. DM refers to dry mass. Each data point and error bar represent the mean and standard error for n = 3 replicates, respectively, except the ones for kale specific leaf area at the R + FR PFD of 35 µmol∙m−2 ∙ s−1, which were for n = 2 replicates due to outlier removal. The r2 indicates the coefficient of determination. RMSE indicates root mean square error. Normalized RMSE is the RMSE divided by the mean of observed values. [Color figure can be viewed at wileyonlinelibrary.com]

References

    1. Achard, P. , Liao L., Jiang C., et al. 2007. “Dellas Contribute to Plant Photomorphogenesis.” Plant Physiology 143, no. 3: 1163–1172. 10.1104/pp.106.092254. - DOI - PMC - PubMed
    1. Allen, T. , Koustenis A., Theodorou G., et al. 2006. “Arabidopsis FHY3 Specifically Gates Phytochrome Signaling to the Circadian Clock.” The Plant Cell 18, no. 10: 2506–2516. 10.1105/tpc.105.037358. - DOI - PMC - PubMed
    1. Al‐Sady, B. , Ni W., Kircher S., Schäfer E., and Quail P. H.. 2006. “Photoactivated Phytochrome Induces Rapid PIF3 Phosphorylation Prior to Proteasome‐Mediated Degradation.” Molecular Cell 23, no. 3: 439–446. 10.1016/j.molcel.2006.06.011. - DOI - PubMed
    1. Aneja, P. , Sanyal R., and Ranjan A.. 2025. “Leaf Growth In Third Dimension: A Perspective of Leaf Thickness from Genetic Regulation to Ecophysiology.” New Phytologist 245, no. 3: 989–999. 10.1111/nph.20246. - DOI - PubMed
    1. Ballaré, C. L. , and Pierik R.. 2017. “The Shade‐Avoidance Syndrome: Multiple Signals and Ecological Consequences.” Plant, Cell & Environment 40, no. 11: 2530–2543. 10.1111/pce.12914. - DOI - PubMed

LinkOut - more resources