. 2025 Mar 27;26(7):3094.
doi: 10.3390/ijms26073094.

Molecular Mechanism of Microgravity-Induced Intestinal Flora Dysbiosis on the Abnormalities of Liver and Brain Metabolism

Affiliations

Molecular Mechanism of Microgravity-Induced Intestinal Flora Dysbiosis on the Abnormalities of Liver and Brain Metabolism

Yi Xiong et al. Int J Mol Sci. .

Abstract

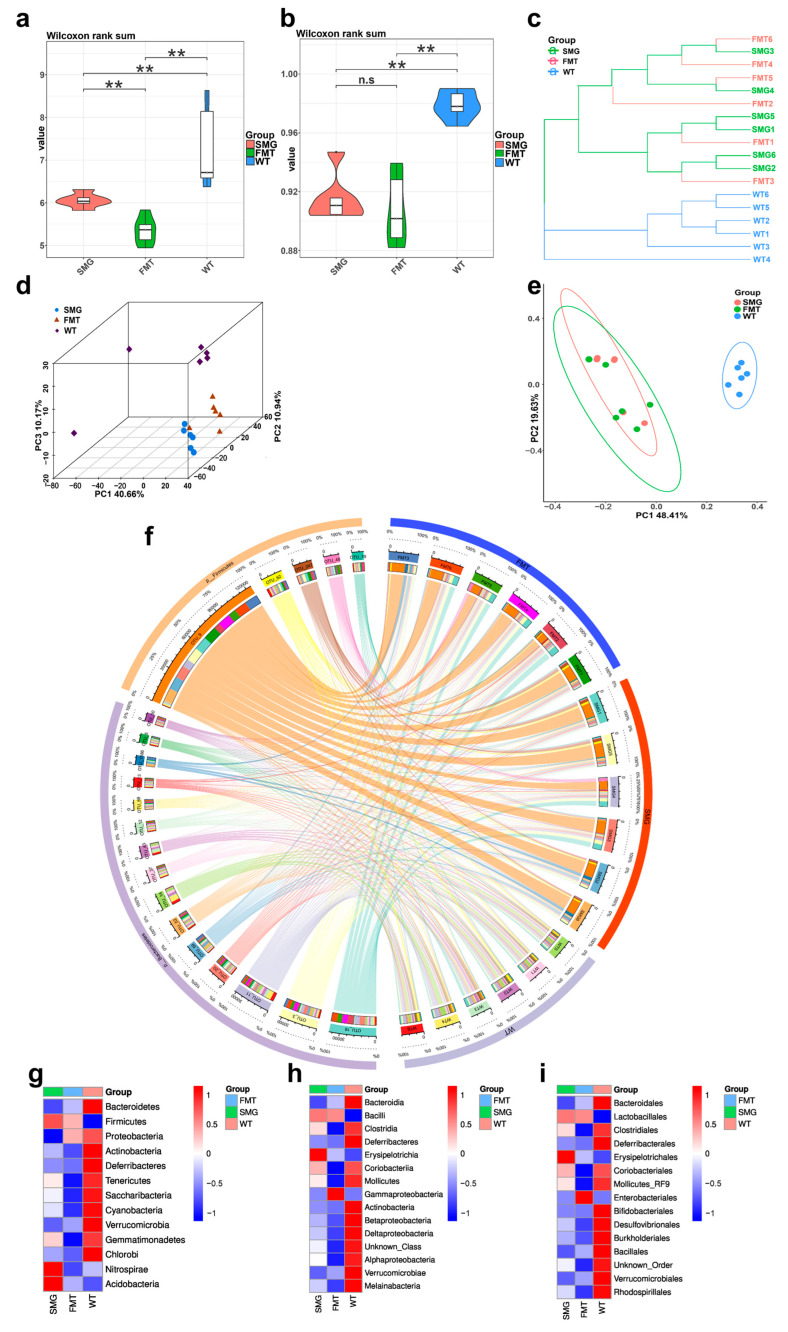
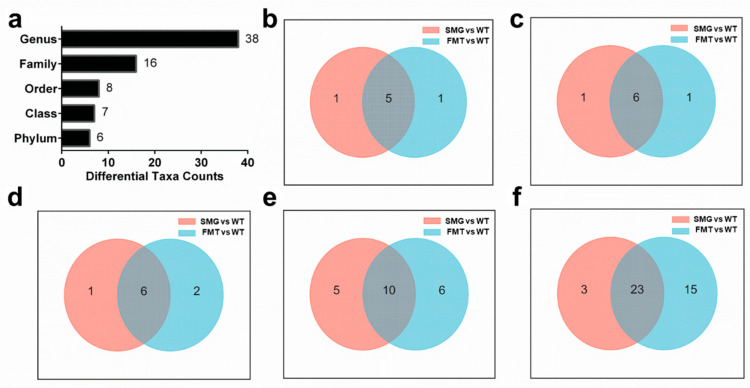
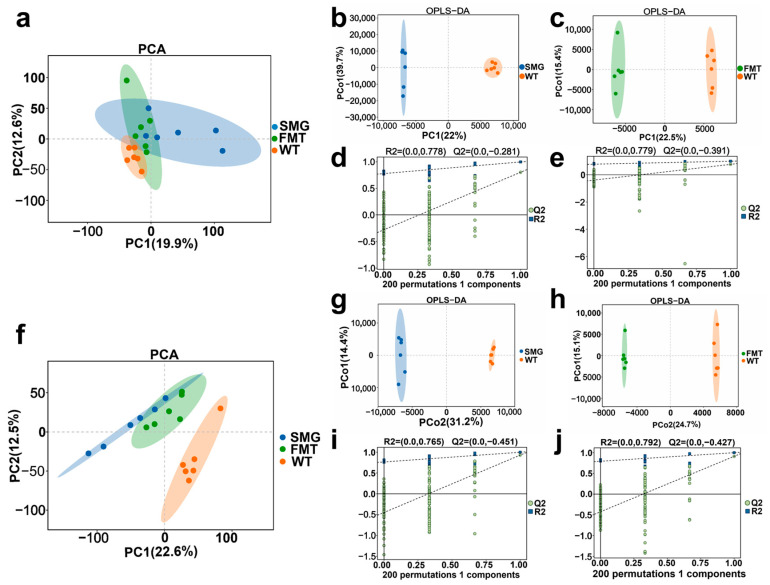
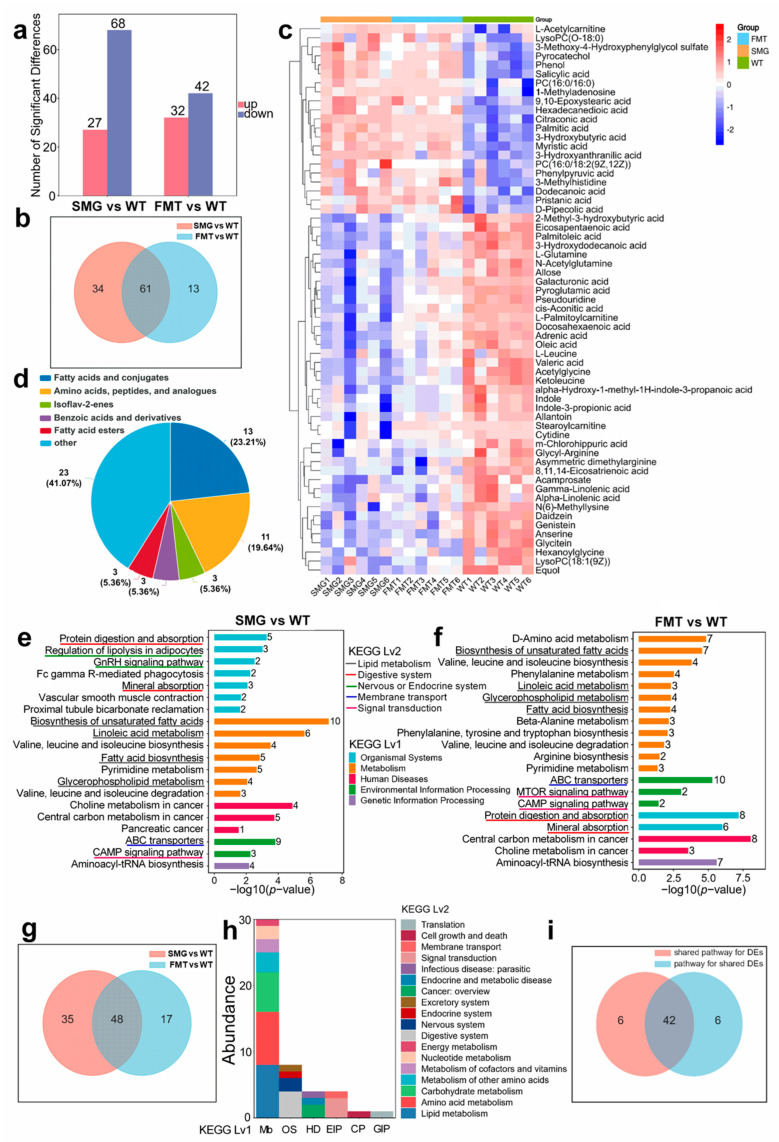
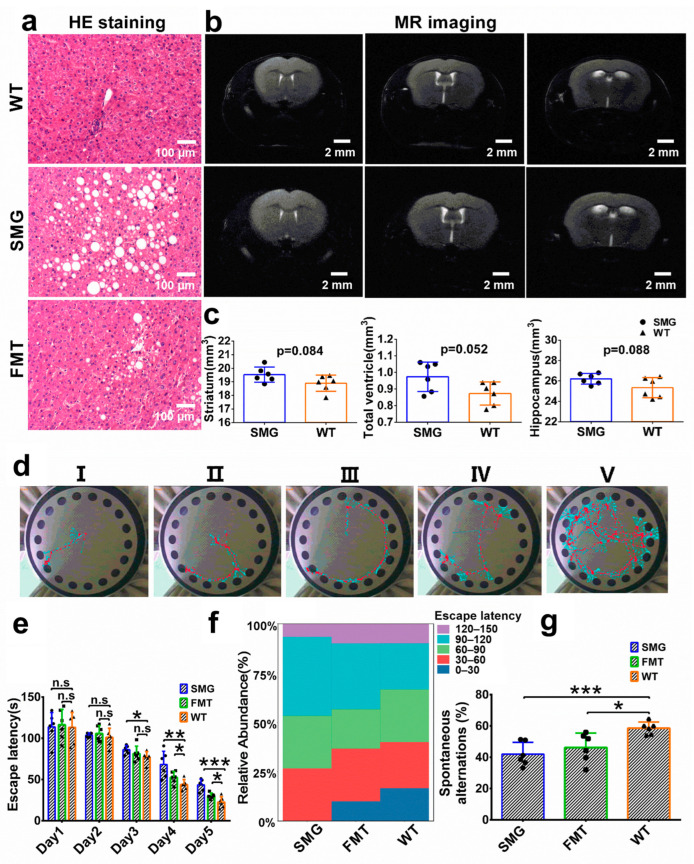
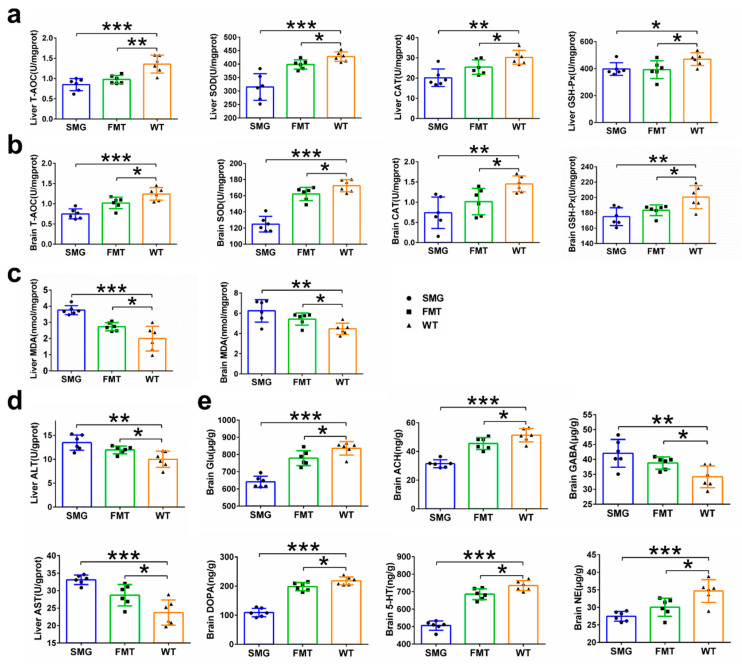
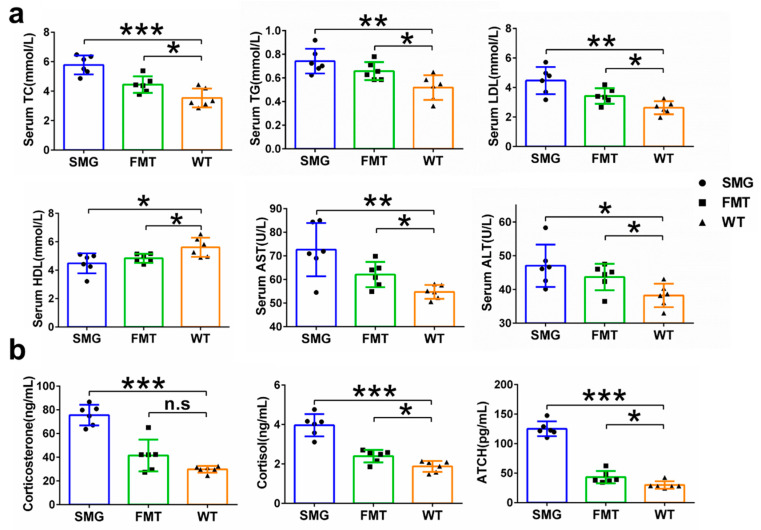
Space flight has many adverse effects on the physiological functions of astronauts. Certain similarities have been observed in some physiological processes of rodents and astronauts in space, although there are also differences. These similarities make rodents helpful models for initial investigations into space-induced physiological changes. This study uses a 3D-Clinostat to simulate microgravity and explores the role of microgravity in space flight-induced liver and brain abnormalities by comparing changes in the gut microbiota, serum metabolites, and the function and physiological biochemistry of liver and brain tissues between the simulated microgravity (SMG) group mice and the wild type (WT) group mice. The study, based on hematoxylin-eosin (HE) staining, 16S sequencing technology, and non-targeted metabolomics analysis, shows that the gut tissue morphology of the SMG group mice is abnormal, and the structure of the gut microbiota and the serum metabolite profile are imbalanced. Furthermore, using PICRUST 2 technology, we have predicted the functions of the gut microbiota and serum metabolites, and the results indicate that the liver metabolism and functions (including lipid metabolism, amino acid metabolism, and sugar metabolism, etc.) of the SMG group mice are disrupted, and the brain tissue metabolism and functions (including neurotransmitters and hormone secretion, etc.) are abnormal, suggesting a close relationship between microgravity and liver metabolic dysfunction and brain dysfunction. Additionally, the high similarity in the structure of the gut microbiota and serum metabolite profile between the fecal microbiota transplant (FMT) group mice and the SMG group mice, and the physiological and biochemical differences in liver and brain tissues compared to the WT group mice, suggest that microgravity induces imbalances in the gut microbiota, which in turn triggers abnormalities in liver and brain metabolism and function. Finally, through MetaMapp analysis and Pearson correlation analysis, we found that valeric acid, a metabolite of gut microbiota, is more likely to be the key metabolite that relates to microgravity-induced gut microbiota abnormalities, disorders of amino acid and lipid metabolism, and further induced metabolic or functional disorders in the liver and brain. This study has significant practical application value for deepening the understanding of the adaptability of living organisms in the space environment.

Keywords: 3D-Clinostat; brain; gut microbiota; liver; metabolic dysfunction; microgravity.


Conflict of interest statement

The authors declare no conflicts of interest.

Figures

Figure 1
Figure 1
Establishment of a mouse microgravity model based on 3D-Clinostat. (a) Demonstration of the 3D-Clinostat device. (b) The differences in food intake, water intake, body weight changes in mice during the microgravity simulation process and organ index at the end of the simulation. (c) The differences in femoral histomorphology between mice at the end of the microgravity simulation and WT mice. (d) Microstructure parameters of mouse femurs after 42 days of microgravity treatment, including BV/TV (bone volume fraction), Tb. Th (trabecular thickness), Tb. N (trabecular number), Ct. Th (cortical thickness), trabecular pattern factor, and Tb. Sp (trabecular separation). The data shown are presented as mean ± SD, n = 6. n.s, no significance, * p < 0.05, ** p < 0.01, *** p < 0.001 versus WT group.
Figure 2
Figure 2
Colonic tissue morphology and gut microbiota structure in mice of the SMG and WT group mice. (a) HE staining of colonic tissue morphology. (b) Appearance of feces. (c) Expression of colonic inflammatory factors. (dh) Differences in gut microbiota diversity, including alpha diversity and beta diversity. (i) Display of the number of microorganisms with significant differences at each taxonomic level. The data shown are presented as mean ± SD, n = 6, * p < 0.05, ** p < 0.01 versus WT group.
Figure 3
Figure 3
Prediction of gut microbiota functions in mice of the SMG and WT group mice. (a) Enrichment characteristics of KEGG level 1 pathways. (b,c) Display of KEGG level 2 pathways enriched in metabolism and organismal systems. (d) Display of KEGG level 3 pathways enriched in lipid metabolism. (e) Display of KEGG level 3 pathways enriched in digestive system. (f) Display of KEGG level 3 pathways enriched in biosynthesis of other secondary metabolites. (g) Display of KEGG level 3 pathways enriched in nervous and endocrine systems.
Figure 4
Figure 4
Comparison of gut microbiota characteristics among FMT, SMG, and WT group mice. (a,b) Differences in α diversity: Shannon index (a) and Simpson index. Differences in β-diversity (b). (c) UPGMA. (d) PCA. (e) PCoA. (f) Circos plot was used to analyze the collinearity relationship between each sample and species as well as the distribution of dominant species among the three groups. (gi) Top 15 gut microbiota with relative abundances at the phylum, class, and order levels in the three groups of mice. The data shown are presented as mean ± SD, n = 6. n.s, no significance, ** p < 0.01. For the heatmap, red represents high abundance and blue represents low abundance.
Figure 5
Figure 5
Replicability of gut microbiota under microgravity effect and screening of key microbiota. (a) The total number of microorganisms with significant differences at each taxonomic level between FMT and WT. (bf) Venn diagram display of differential microbiota at each taxonomic level between the WT group and the SMG group as well as between the WT group and the FMT group.
Figure 6
Figure 6
Metabolic profile analysis of different groups in positive and negative source mode. (a) PCA score plots for each group. (b,c) OPLS-DA score plots. (d,e) The 200 replacement tests for SMG versus WT group and FMT versus WT group in the positive source model. (f) PCA score plots for each group. (g,h) OPLS-DA score plots. (i,j) The 200 replacement tests for SMG versus WT group and FMT versus WT group in the negative source model (n = 6).
Figure 7
Figure 7
Analysis of differential metabolites in three groups of mice. (a) Analysis of the number of up-regulated and down-regulated significant differential metabolites. (b) Pie chart of common differential metabolites. (c) Expression profiles of common differential metabolites. (d) Classification of compounds of common differential metabolites (Top 5 subclasses). (e) KEGG functional enrichment analysis of differential metabolites in SMG vs. WT. (f) KEGG functional enrichment analysis of differential metabolites in FMT vs. WT. (g) Analysis of metabolic pathways jointly participated by differential metabolites in SMG vs. WT and FMT vs. WT. (h) Analysis of the functions of target organs. Mb: Metabolism. OS: Organismal systems. HD: Human diseases. EIP: Environmental information processing. CP: Cellular processes. GIP: Genetic information processing. (i) Analysis of pathways jointly regulated by differential metabolites between SMG vs. WT and FMT vs. WT. For the heatmap, red represents high abundance and blue represents low abundance.
Figure 8
Figure 8
SMG and FMT induced liver damage and cognitive deficits in mice. (a) HE stained sections of the liver in SMG, FMT, and WT mice. (b) Representative mid-sagittal slices for the coronal sections under brain MRI. (c) Volumes of the striatum, ventricles, and hippocampus. (d) Five representative tracks. Cyan tracks, path of the mouse leaving the starting hole to the exploration area. Red tracks, path of the mouse from the exploration area back to the starting hole. (e) The 5-day escape latency. (f) Distribution of latency periods of the three groups of mice in the Barnes maze test. (g) Spontaneous alternations in the Y-maze test. The data shown are presented as mean ± SD, n = 6. n.s, no significance, * p < 0.05, ** p < 0.01, *** p < 0.001 versus WT group.
Figure 9
Figure 9
Mice in the SMG group and the FMT group experienced similar metabolic disorders in the liver and brain. (ac) Effects of microgravity and fecal microbiota transplantation treatments on the activities of antioxidant indexes and MDA levels in the brains and livers of mice. (d) Effects of microgravity and fecal microbiota transplantation treatments on liver function in mice. (e) Effects of microgravity and fecal microbiota transplantation treatments on typical neurotransmitters in the brains of mice. The data shown are presented as mean ± SD, n = 6, * p < 0.05, ** p < 0.01, *** p < 0.001 versus WT group.
Figure 10
Figure 10
Changes in physiological and biochemical indexes related to the liver and brain in serum. (a) Changes in blood lipid levels, AST (aspartate aminotransferase), and ALT (alanine aminotransferase) in serum. (b) Changes in the serum HPA axis (corticosterone, cortisol, adrenocorticotropic hormone). The data shown are presented as mean ± SD, n = 6. n.s, no significance, * p < 0.05, ** p < 0.01, *** p < 0.001 versus WT group.

Similar articles

References

    1. Sisovas L., Ceponis A., Borodinas S. The Challenges of Piezoelectric Actuators and Motors Application in a Space Environment. Actuators. 2024;13:312. doi: 10.3390/act13080312. - DOI
    1. Tian Y., Ma X.L., Yang C.F., Su P.H., Yin C., Qian A.R. The Impact of Oxidative Stress on the Bone System in Response to the Space Special Environment. Int. J. Mol. Sci. 2017;18:2132. doi: 10.3390/ijms18102132. - DOI - PMC - PubMed
    1. Drago-Ferrante R., Di Fiore R., Karouia F., Subbannayya Y., Das S., Mathyk B.A., Arif S., Guevara-Cerdán A.P., Seylani A., Galsinh A.S., et al. Extraterrestrial Gynecology: Could Spaceflight Increase the Risk of Developing Cancer in Female Astronauts? An Updated Review. Int. J. Mol. Sci. 2022;23:7465. doi: 10.3390/ijms23137465. - DOI - PMC - PubMed
    1. Yuan M.Q., Liu H.Z., Zhou S.H., Zhou X., Huang Y.E., Hou F., Jiang W. Integrative Analysis of Regulatory Module Reveals Associations of Microgravity with Dysfunctions of Multi-body Systems and Tumorigenesis. Int. J. Mol. Sci. 2020;21:7585. doi: 10.3390/ijms21207585. - DOI - PMC - PubMed
    1. Garrett-Bakelman F.E., Darshi M., Green S.J., Gur R.C., Lin L., Macias B.R., McKenna M.J., Meydan C., Mishra T., Nasrini J., et al. The NASA Twins Study: A multidimensional analysis of a year-long human spaceflight. Science. 2019;364:eaau8650. - PMC - PubMed

LinkOut - more resources