

Integrative Utilization of Transcriptomics and Metabolomics Sheds Light on Disparate Growth Performance of Whiteleg Shrimp, Litopenaeus vannamei
- PMID: 40243931
- PMCID: PMC11988672
- DOI: 10.3390/ijms26073133
Integrative Utilization of Transcriptomics and Metabolomics Sheds Light on Disparate Growth Performance of Whiteleg Shrimp, Litopenaeus vannamei
Abstract
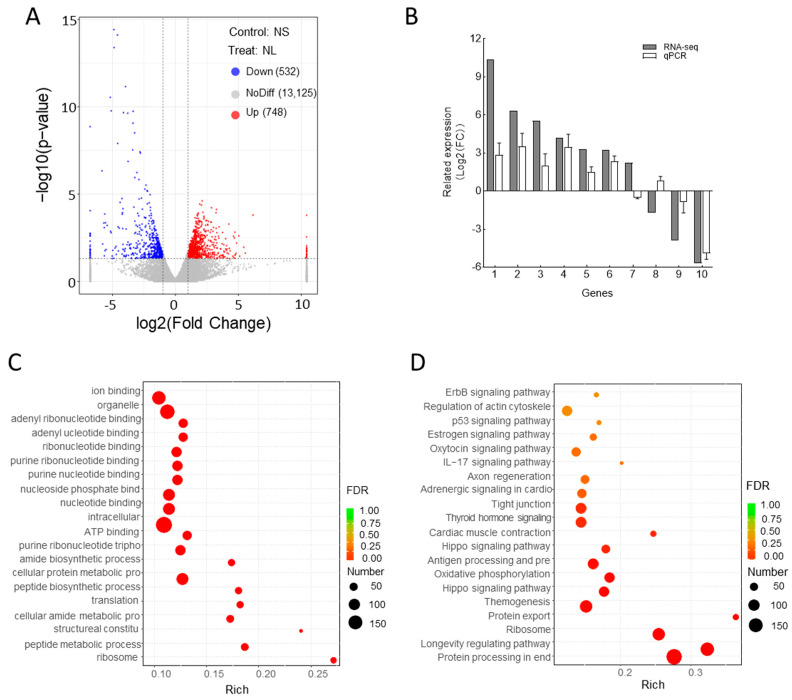
Litopenaeus vannamei is a key economic species in aquaculture, yet the molecular mechanisms underlying its growth variability remain unclear. This study conducted transcriptomic and metabolomic analyses of fast-growing (NL) and slow-growing (NS) shrimp under identical conditions. A total of 1280 differentially expressed genes (DEGs) related to protein processing, ribosomes, and oxidative phosphorylation, along with 5297 differentially abundant metabolites (DMs) involved in arginine biosynthesis, amino acid metabolism, and pantothenate and CoA biosynthesis, were identified and analyzed. An integrative analysis revealed that the NL shrimp exhibited an enhanced retinol, glutathione, riboflavin, and purine metabolism, which implies a higher tolerance to environmental stress. In contrast, the NS shrimp showed increased fatty acid degradation and an accelerated TCA cycle. This suggests that NS shrimp might require a substantial amount of energy to cope with environmental changes, consequently resulting in increased energy expenditures. This study provides significant insights into the molecular mechanisms underlying the growth disparity in L. vannamei, offering valuable data for future research aimed at optimizing shrimp growth performance and enhancing aquaculture productivity.
Keywords: Litopenaeus vannamei; growth trait; metabolomics; transcriptomics.
Conflict of interest statement
The authors declare no conflicts of interest.
Figures


Similar articles
-
Stress response and tolerance mechanisms of ammonia exposure based on transcriptomics and metabolomics in Litopenaeus vannamei.Ecotoxicol Environ Saf. 2019 Sep 30;180:491-500. doi: 10.1016/j.ecoenv.2019.05.029. Epub 2019 May 20. Ecotoxicol Environ Saf. 2019. PMID: 31121556
-
Integrated application of transcriptomics and metabolomics provides insights into acute hepatopancreatic necrosis disease resistance of Pacific white shrimp Litopenaeus vannamei.mSystems. 2023 Aug 31;8(4):e0006723. doi: 10.1128/msystems.00067-23. Epub 2023 Jun 26. mSystems. 2023. PMID: 37358285 Free PMC article.
-
DNA methylation regulates growth traits by influencing metabolic pathways in Pacific white shrimp (Litopenaeus vannamei).BMC Genomics. 2025 May 20;26(1):511. doi: 10.1186/s12864-025-11688-6. BMC Genomics. 2025. PMID: 40394505 Free PMC article.
-
Comprehensive Transcriptomic and Metabolomic Analysis of the Litopenaeus vannamei Hepatopancreas After WSSV Challenge.Front Immunol. 2022 Feb 10;13:826794. doi: 10.3389/fimmu.2022.826794. eCollection 2022. Front Immunol. 2022. PMID: 35222409 Free PMC article.
-
Proteomic and metabolomic responses in hepatopancreas of whiteleg shrimp Litopenaeus vannamei infected by microsporidian Enterocytozoon hepatopenaei.Fish Shellfish Immunol. 2019 Apr;87:534-545. doi: 10.1016/j.fsi.2019.01.051. Epub 2019 Feb 2. Fish Shellfish Immunol. 2019. PMID: 30721776
References
-
- Katneni V.K., Shekhar M.S., Jangam A.K., Prabhudas S.K., Krishnan K., Kaikkolante N., Paran B.C., Baghel D.S., Koyadan V.K., Jena J. Novel isoform sequencing based full-length transcriptome resource for Indian white shrimp, Penaeus indicus. Front. Mar. Sci. 2020;7:605098
-
- Fawzy S., Wang W., Wu M., Yi G., Huang X. Effects of dietary different canthaxanthin levels on growth performance, antioxidant capacity, biochemical and immune-physiological parameters of white shrimp (Litopenaeus vannamei) Aquaculture. 2022;556:738276.
-
- Zhu L., Li C., Su X., Guo C., Wang Z., Jin C., Li Y., Li T. Identification and assessment of differentially expressed genes involved in growth regulation in Apostichopus japonicus. Genet. Mol. Res. 2013;12:3028–3037. - PubMed
-
- Zhang S., Yang H., Liu S., Zhang L., Ru X., Xu D. The influence of genetics factor on key growth traits and quantitative genetic analysis of sea cucumber Apostichopus japonicus (Selenka) heat-resistant and fast-growing strain. Aquac. Int. 2015;23:219–233. doi: 10.1007/s10499-014-9810-6. - DOI
MeSH terms
Grants and funding
- 2023YFD2401701/National Key Research and Development Program of China
- XDB07302004/Strategic Priority Research Program of the Chinese Academy of Sciences
- 2024-MRB-00-001/Research on Breeding Technology of Candidate Species for Guangdong Modern Marine Rranching
- E4DQ2B01/Molecular Mechanism of Rapid Growth and Stress Resistance Traits in Litopenaeus vannamei
- 2023B12060047/Science and Technology Planning Project of Guangdong Province, China
LinkOut - more resources
Full Text Sources
Miscellaneous
