Comparative Study
. 2025 Mar 28;26(7):3144.
doi: 10.3390/ijms26073144.

Human-Specific Organization of Proliferation and Stemness in Squamous Epithelia: A Comparative Study to Elucidate Differences in Stem Cell Organization

Affiliations
Comparative Study

Human-Specific Organization of Proliferation and Stemness in Squamous Epithelia: A Comparative Study to Elucidate Differences in Stem Cell Organization

Ashlee Harris et al. Int J Mol Sci. .

Abstract

The mechanisms that influence human longevity are complex and operate on cellular, tissue, and organismal levels. To better understand the tissue-level mechanisms, we compared the organization of cell proliferation, differentiation, and cytoprotective protein expression in the squamous epithelium of the esophagus between mammals with varying lifespans. Humans are the only species with a quiescent basal stem cell layer that is distinctly physically separated from parabasal transit-amplifying cells. In addition to these stark differences in the organization of proliferation, human squamous epithelial stem cells express DNA repair-related markers, such as MECP2 and XPC, which are absent or low in mouse basal cells. Furthermore, we investigated whether the transition from basal to suprabasal is different between species. In humans, the parabasal cells seem to originate from cells detaching from the basement membrane, and these can already begin to proliferate while delaminating. In most other species, delaminating cells have been rare or their proliferation rate is different from that of their human counterparts, indicating an alternative mode of how stem cells maintain the tissue. In humans, the combination of an elevated cytoprotective signature and novel tissue organization may enhance resistance to aging and prevent cancer. Our results point to enhanced cellular cytoprotection and a tissue architecture which separates stemness and proliferation. These are both potential factors contributing to the increased fitness of human squamous epithelia to support longevity by suppressing tumorigenesis. However, the organization of canine oral mucosa shows some similarities to that of human tissue and may provide a useful model to understand the relationship between tissue architecture, gene expression regulation, tumor suppression, and longevity.

Keywords: MECP2; XPC; comparative biology; esophageal stem cells; multiplex immunofluorescence; spatial biology; squamous epithelial biology.


Conflict of interest statement

The authors declare no conflicts of interest.

Figures

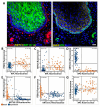
Figure 1
Figure 1
Low proliferation and high MECP2 and XPC expression are most pronounced in humans and absent in mice. (AD). Fluorescent images of oral squamous epithelial from four different species showing MECP2, TP63, XPC (basal cell markers), and MCM2 (proliferation) expression. (EH). The comparison between basal and suprabasal cells shows that in mice there is no difference in MECP2, XPC and Histone H1 expression, but mouse suprabasal cells are non-proliferative. In humans and dogs, MCM2 expression is mainly found in suprabasal cells. Data shown are from manual multiplex stainings and manual cell segmentation in Leica LASX. Data were exported to Microsoft Excel Version 16.95.1 and Graphpad. * indicates significant difference of p < 0.5 while ns indicates no statistical difference. White bar in immunofluorescence image represents 50 µm.
Figure 2
Figure 2
Human basal cell heterogeneity based on characteristic markers. (A). Multiplex immunofluorescence staining of human esophageal epithelium exhibiting a distinctly basal cell expression of XPC. (B). A high percentage of basal cells (orange dots) are XPC and ITGB1 positive. (C). Although there is significant overlap between XPC and KRT15 expression in basal cells, subpopulations appear to be XPC, KRT15, or ITGB1 positive. (D). No XPC+ basal cell expresses differentiation marker KRT10 or 13. (E,F). Neither KRT15 nor ITGB1 are enriching basal cell populations as well as XPC; and both can show co-expression with KRT10/13. (G). EGFR is not a specific basal cell marker. Data are derived from manual multiplex stainings and manual cell segmentation (see Supplementary Table S3 for staining outline). Data were exported from Leica LASX and analyzed in Excel and Graphpad. White bar in immunofluorescence image represents 50 µm.
Figure 3
Figure 3
Quantification and characterization of delaminating cell populations in comparison to adjacent cells. (A). Schematic diagram of mechanisms to deliver cells to the suprabasal cell compartment. (B,C). Example of delaminating cells in human and dog epithelia, respectively. Inserts show exemplary delaminating cells at higher magnification. (B1/C1). Using the basal cell marker MECP2, delaminating cells (D) exhibit a pronounced drop in MECP2 expression compared to adjacent basal cells (B) reaching levels similar to adjacent parabasal cells (P). This observation is true for both humans and dogs. (B2/C2). In contrast to MECP2, p63 expression is not different in B, D and P cells in humans. However, in dogs, p63 expression drops like MECP2. (B3/C3). The intensity of MCM2 expression per B, D, and P cell does not change. White bar in (A) represents 50µm.
Figure 4
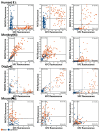
Figure 4
Characterization of basal cells versus suprabasal cells of multiple species using basal cell markers XPC, MECP2, p63 and proliferation marker MCM2. Manual multiplex stainings were analyzed by manually identifying cells and measuring their expression levels using Leica LASX version 3.7 software.
Figure 5
Figure 5
Analysis of canine basal cell populations and their similarities to the human condition. (A). Example of dog oral mucosa 16-plex multiplex stain showing 5 markers. (B,C). UMAP clustering of epithelial cells shows 6 cell populations including 2 basal cell populations (green and red). (D). Heatmap of FTH1 expression within UMAP shows enhanced expression in “green” basal cell population. (E). Definition of “green” basal cells (Basal 1) as cells similar to human basal cells. Data are derived from manual multiplex stainings (see Supplementary Table S5). Confocal images were exported and used in MACSiQView to cluster cell populations using UMAP. To generate box plots, data were exported from MACSiQView and analyzed in Graphpad. * indicates significant difference of p < 0.5 while ns indicates no statistical difference. White bar in (A) indicates 50 µm.
Figure 6
Figure 6
Determining human specific basal cell gene expression. (A). Venn diagram to identify human basal cell markers based on scRNAseq datasets. (B). Commonalities and differences in mouse and human basal cell markers: highlighting a role of NRF2 signaling, ferroptosis, and a lack of DNA repair related basal markers XPC and MECP2 in scRNAseq data. (C). In humans, basal cells (white arrowheads) express little EZH2. EZH2 (red) is mainly expressed in proliferating (PCNA+ green) human parabasal cells. (D). In contrast, in mice EZH2 (red) is expressed in proliferating (PCNA, green) basal cells (white arrows). (E,F). CAV1 is expressed in basal cells (white arrows) in both humans and mice. (G,H). ASS1 is expressed in basal cells (white arrows) in both humans and mice. White bar in (H) represents 50 µm and can be applied to (CF) as well.
Figure 7
Figure 7
Proximity ligation assay (PLA)-based analysis of MECP2–XPC interactions. (A). Representative PLA examples depicting interactions specifically in human basal cells but loss in human esophageal dysplastic lesions and SCC. PLA signal occurs as orange dots and some of them are highlighted with orange arrows on epithelial cells. White arrows indicate stromal artifacts. To define basal cells several markers were stained subsequent to the PLA procedure including SLC3A2, KRT10/13, and Ki67 (see Supplementary Figure S4, which also contains information about control PLA experiments). Below the PLA image are hematoxylin and eosin (H&E) stains from the same area. Black bar in the H&E stain represents 50 µm. (B). Quantification of PLAs showing a significant reduction in PLA signal from normal basal cells (N) to suprabasal cells (NS) in normal squamous epithelial. A similar or even more pronounced drop in PLA signal is observed during the progression from normal (N) to squamous cell carcinoma (SCC). Student’s t test shows a statistical reduction in PLA signal between NB and the following states: NS, LGD (low grade dysplasia), HGD (high grade dysplasia), but not SCC. (C,D). MECP2 and XPC expression, respectively, are reduced similar to the PLA signal from normal to dysplasia and SCC. Student’s t test shows a statistical reduction in MECP2 as well as XPC expression between NB and the following states: HGD and SCC. Statistical significance: * p < 0.05, ** p < 0.01, *** p < 0.001, **** p < 0.0001. N, normal basal cells from 25 samples; NS, normal suprabasal cells from 25 samples; LGD, low-grade dysplasia basal cells from 14 lesions; HGD, basal like cells from 19 high-grade dyspalsias; SCC, basal like cells from 9 SCC samples. Analysis solely based on cells rather than averages for each sample are provided in Supplementary Figure S4. All samples from TMA BBS02011, imaged on a Leica SP5 microscope, analyzed in MACSiqView, and graphs generated in Prism.

Similar articles

References

    1. de Magalhaes J.P., Costa J. A database of vertebrate longevity records and their relation to other life-history traits. J. Evol. Biol. 2009;22:1770–1774. doi: 10.1111/j.1420-9101.2009.01783.x. - DOI - PubMed
    1. Hayflick L. Entropy explains aging, genetic determinism explains longevity, and undefined terminology explains misunderstanding both. PLoS Genet. 2007;3:e220. doi: 10.1371/journal.pgen.0030220. - DOI - PMC - PubMed
    1. Tomasetti C., Vogelstein B. Cancer etiology. Variation in cancer risk among tissues can be explained by the number of stem cell divisions. Science. 2015;347:78–81. doi: 10.1126/science.1260825. - DOI - PMC - PubMed
    1. Oh J., Lee Y.D., Wagers A.J. Stem cell aging: Mechanisms, regulators and therapeutic opportunities. Nat. Med. 2014;20:870–880. doi: 10.1038/nm.3651. - DOI - PMC - PubMed
    1. Dunaway S., Rothaus A., Zhang Y., Luisa Kadekaro A., Andl T., Andl C.D. Divide and conquer: Two stem cell populations in squamous epithelia, reserves and the active duty forces. Int. J. Oral. Sci. 2019;11:26. doi: 10.1038/s41368-019-0061-2. - DOI - PMC - PubMed

Publication types

LinkOut - more resources