. 2025 Jul;10(7):101248.
doi: 10.1016/j.jacbts.2025.02.008. Epub 2025 Apr 16.

Oversized Conduits Predict Stenosis in Tissue Engineered Vascular Grafts

Affiliations

Oversized Conduits Predict Stenosis in Tissue Engineered Vascular Grafts

Kevin M Blum et al. JACC Basic Transl Sci. 2025 Jul.

Abstract

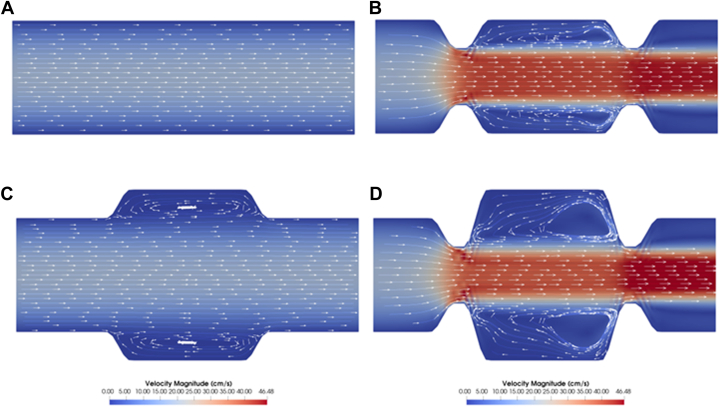
Tissue-engineered vascular grafts (TEVGs) offer promising advancements in treating congenital heart disease by enabling the creation of autologous tissue for complex cardiac repairs. Our approach involves implanting biodegradable scaffolds seeded with autologous cells that remodel into functional neovessels. To understand better the factors guiding neovessel formation, we evaluated 50 ovine thoracic TEVGs using angiography at 1 and 6 weeks postimplantation. Nondimensionalization accounted for anatomical differences between animals and identified hemodynamics and surgical sizing as potential driving factors. Regression analysis revealed that narrowing at the inflow anastomosis and graft oversizing correlated significantly with stenosis development. Computational fluid dynamics showed that these factors influenced wall shear stress and flow patterns, contributing to neovessel narrowing. Comparisons with clinical trial data from Fontan conduits supported these findings, emphasizing that matching graft size to the native inflow vessel can reduce stenosis and enhance TEVG performance.

Keywords: computational fluid dynamics; oversizing; stenosis; tissue engineered vascular graft.


Conflict of interest statement

Funding Support and Author Disclosures This project was supported by National Institutes of Health grants R01 HL139796 (to Drs Humphrey, Marsden, and Breuer), R01 HL163065 (to Dr Breuer), and UH3 HL148693 (to Dr Breuer) in addition to Department of Defense award number W81XWH-22-1-0597 (to Dr Breuer). Dr Breuer is an inventor on patent/patent applications (2015252805 [Australia], 2016565483 [Japan], 855,370, 9,446,175, 9,782,522, 10,300,082, 61/987,910, 62/266,309, 62/309,285, 62/209,990, 62/936,225) submitted by Yale University and/or Nationwide Children’s Hospital that cover methods of improving the design, manufacturing, or performance of tissue-engineered vascular grafts; is a founder of Lyst Therapeutics; and has received grant support from Gunze Ltd, and Gunze Ltd provided support for the clinical trial. All other authors have reported that they have no relationships relevant to the contents of this paper to disclose.

Figures

None
Graphical abstract
Figure 1
Figure 1
Angiography Diagram Labeled representative angiographies in sheep at 1 week (Left) and 6 weeks (Right) post–tissue-engineered vascular graft (TEVG) implantation, demonstrating key morphologic parameters of interest. Arrow represents direction of blood flow within the inferior vena cava (IVC) and TEVG.
Figure 2
Figure 2
Regression Analysis (A) Representative angiographies in sheep at 1 week (top) and 6 weeks (bottom) post–tissue-engineered vascular graft implantation at different combinations of key parameters and their effects on stenosis. Univariable regression outputs of oversizing (B), inflow narrowing (C), and inflow diameter (D) shown with mean regression (solid line) and 95% CIs (dotted lines). (E) Residual plot of multivariable analysis of stenosis vs oversizing and inflow narrowing. Arrows indicate the direction of blood flow.
Figure 3
Figure 3
Visualization of Computational Fluid Dynamics Hemodynamics Diagrams of flow in representative geometries of the interposition ovine tissue-engineered vascular graft, including (A) an ideally sized graft where the anastomosis diameter and graft diameter perfectly match the attached inferior vena cava diameter (B) a graft where the anastomosis diameter is 50% less than the inferior vena cava diameter but the graft diameter matches the inferior vena cava diameter, (C) a graft where the anastomosis diameter perfectly matches the inferior vena cava diameter but the graft diameter is 50% larger than the inferior vena cava diameter, and (D) a graft where the anastomosis is 50% less than that of the inferior vena cava diameter and the graft diameter is 50% greater than that of the inferior vena cava diameter. Deviations from the ideally sized graft caused significant recirculation and changes to the velocity profile. CFD = computational fluid dynamics; IVC = inferior vena cava; PBS = phosphate buffered saline; TEVG = tissue-engineered vascular graft.
Figure 4
Figure 4
Computational Fluid Dynamics WSS and Pressure Distribution Wall shear stress direction (WSSdir) and pressure vary across the axis of the interposition graft complex while varying (A) the graft diameter, (B) the anastomosis diameter, and (C) both the anastomosis and graft diameter. Increased graft diameter generally lowered the absolute value of wall shear stress magnitude while decreased graft anastomosis caused greater pressure drops across the interposition complex. Both resulted in flow recirculation and reverse WSSdir.
Figure 5
Figure 5
Computational Fluid Dynamics Analysis of WSS Direction and Magnitude (A) Average wall shear stress (WSS) magnitude within the tissue-engineered vascular graft decreased with increased graft diameter, but had a nonlinear relationship with graft anastomosis size. Decreased inflow anastomosis size resulted in (B) higher WSS magnitude in the reverse direction of the vessel axis and (C) both decreased anastomosis and increased graft diameter resulted in complete reversal of WSS direction within the entire tissue-engineered vascular graft. Analysis of local Reynolds number at (D) the inflow anastomosis and (E) the midgraft demonstrated differences across the geometries, however all values were within the laminar regime. (F) Differences in local Reynolds number from the inflow anastomosis to the midgraft across different geometries.
Figure 6
Figure 6
Clinical Tissue-Engineered Vascular Graft Regression Analysis (A) Representative cardiac magnetic resonance imaging of tissue-engineered vascular grafts implanted in clinical trial patients as Fontan conduits at 1 week (left) and 6 months (right). Regression analysis of maximal 6-month stenosis against (B) graft oversizing and (C) inflow narrowing demonstrated similar trends to that seen in the large animal model.

References

    1. Jacobs J.P., Mavroudis C., Quintessenza J.A., et al. Reoperations for pediatric and congenital heart disease: an analysis of the Society of Thoracic Surgeons (STS) congenital heart surgery database. Semin Thorac Cardiovasc Surg Pediatr Card Surg Annu. 2014;17(1):2–8. doi: 10.1053/j.pcsu.2014.01.006. - DOI - PMC - PubMed
    1. Mayer Je, Mayer J.E. Uses of homograft conduits for right ventricle to pulmonary artery connections in the neonatal period. Semin Thorac Cardiovasc Surg. 1995;7(3):130–132. - PubMed
    1. Ovroutski S., Ewert P., Alexi-Meskishvili V., et al. Absence of pulmonary artery growth after fontan operation and its possible impact on late outcome. Ann Thorac Surg. 2009;87(3):826–831. doi: 10.1016/j.athoracsur.2008.10.075. - DOI - PubMed
    1. Alexi-Meskishvili V., Ovroutski S., Ewert P., et al. Optimal conduit size for extracardiac Fontan operation. Eur J Cardio-Thorac Surg. 2000;18(6):690–695. doi: 10.1016/s1010-7940(00)00593-5. - DOI - PubMed
    1. Itatani K., Miyaji K., Tomoyasu T., et al. Optimal conduit size of the extracardiac Fontan operation based on energy loss and flow stagnation. Ann Thorac Surg. 2009;88(2):565–572. doi: 10.1016/j.athoracsur.2009.04.109. discussion 572-573. - DOI - PubMed

LinkOut - more resources