. 2025 Sep;292(18):4808-4832.
doi: 10.1111/febs.70098. Epub 2025 Apr 17.

Allosteric modulation of protein kinase A in individuals affected by NLPD-PKA, a neurodegenerative disease in which the PRKAR1B L50R variant is expressed

Affiliations

Allosteric modulation of protein kinase A in individuals affected by NLPD-PKA, a neurodegenerative disease in which the PRKAR1B L50R variant is expressed

Tal Benjamin-Zukerman et al. FEBS J. 2025 Sep.

Abstract

Protein kinase A (PKA) is a crucial signaling enzyme in neurons, with its dysregulation being implicated in neurodegenerative diseases. Assembly of the PKA holoenzyme, comprising a dimer of heterodimers of regulatory (R) and catalytic (C) subunits, ensures allosteric regulation and functional specificity. Recently, we defined the RIβ-L50R variant as a causative mutation that triggers protein aggregation in a rare neurodegenerative disease, neuronal loss, and parkinsonism driven by a PKA mutation (NLPD-PKA). However, the mechanism underlying uncontrolled PKA allosteric regulation and its connection to the functional outcomes leading to clinical symptoms remains elusive. In this study, we established an in vitro model using patient-derived cells for a personalized approach and employed direct measurements of purified proteins to investigate disease mechanisms in a controlled environment. Structural analysis and circular dichroism spectroscopy revealed that cellular protein aggregation resulted from misfolded RIβ-subunits, preventing holoenzyme assembly and anchoring through A-kinase anchoring proteins (AKAPs). While maintaining high affinity to the C-subunit, the resulting RIβ-L50R:C heterodimer exhibits reduced cooperativity, requiring lower cAMP concentrations for dissociation. Consequently, there was an increased translocation of the C-subunit into the nucleus, impacting gene expression. We successfully controlled C-subunit translocation by introducing a mutation that decreased RIβ:C dissociation in response to elevated cAMP levels. This research thus sets the stage for developing therapeutic strategies that modulate PKA assembly and allostery, thus exerting control over the unique molecular signatures identified in the disease-associated transcriptome profile.

Keywords: PRKAR1B; allostery; holoenzyme assembly; neurodegenerative disease; protein kinase A.


Conflict of interest statement

The authors declare no conflict of interest.

Figures

Fig. 1
Fig. 1
PRKAR1B variants. (A) PRKAR1B domain structure encompasses a dimerization and docking (D/D) domain, succeeded by an inhibitor sequence and a pair of cAMP‐binding domains. Displayed below are all the identified variants of human PRKAR1B, sourced from the UniProt database. Variants that have been identified as likely pathogenic or confirmed pathogenic are marked with circles. Red circles pinpoint the variants that are the focus of this manuscript. The sequence for the D/D domain is presented, with the residues being investigated in this work accentuated. Helices A0, A1, and A3 from each protomer contribute to dimerization. (B) In each R‐subunit, the D/D domain establishes an isologous dimer. This arrangement features identical binding sites on both subunits that interface complementarily when rotated by 180° in relation to one another. Disease‐related residues are represented as spheres. Detailed views of individual residues under investigation, visualized using PyMOL, are shown in boxes. (C1) After its purification, the 1st size‐exclusion chromatography (SEC) elution profile (n = 2) for the D/D domain displays multiple peaks likely corresponding to multimeric species. The dimeric D/D is expected to elute at ~ 90 mL. Collection of ~ 90 mL peak and re‐injection to SEC (n = 2) does not show repopulate of multimeric species, indicating that the dimeric D/D domain is stable. (C2) Circular dichroism (CD) spectrum of the wildtype D/D domain (n = 13) displays two minima at 208 and 222 nm, which is characteristic of α‐helical proteins. The CD spectrum of L50R (n = 9) loses the typical features of α‐helices, indicating that this mutation disrupts the D/D domain fold. Deconvolution of the CD data indicates that the wildtype and L50R proteins have 87% and 43% helicity, respectively. (D) PC12 cells were co‐transfected to express mKO2‐tagged RIβ‐WT or RIβ variants and mCerulean‐dAKAP1. Cell lysates from three independent experiments divided into soluble and insoluble fractions which were separated by SDS/PAGE under both non‐reduced (upper gel) or reduced conditions (lower gel). Western blot analysis was performed with GAPDH serving as a loading control for the soluble fraction and TOPO1 as a loading control for the insoluble fraction. (E) Confocal microscopy images depict transiently transfected PC12 cells expressing mKO2‐tagged RIβ‐WT or mutants (upper panel) and the same cells were co‐transfected by using mKO2‐tagged RIβ‐WT or mutants and dAKAP1(lower panel). Representative Images from three independent experiments were captured at 63× magnification, with arrows highlighting the aggregates. The scale bar represents 10 μm. CNB; cyclic nucleotide‐binding domain.
Fig. 2
Fig. 2
Impact of the L50/L50R heterozygous mutation on RIβ dimerization and C‐subunit nuclear translocation in patient‐derived cells. (A) Comparison of RIβ protein expression in cell lysates from a healthy individual (L50/L50) and a patient with the L50R heterozygous mutation (L50/L50R). Lysates from six independent experiments were subjected to SDS/PAGE under reducing conditions. Arrows indicate the migration of RIβ proteins in both monomer and dimer forms. The C‐subunit expression was determined using a specific antibody. GAPDH was used as a loading control. (B) Quantification of RIβ monomer‐to‐dimer ratios from six independent experiments. RIβ band intensities were normalized to GAPDH for each experiment. Data are presented as the mean ± standard error (SE), with statistical significance assessed using the Mann–Whitney test (*P ≤ 0.05). (C) Quantification of total RIβ protein expression, normalized to GAPDH, based on band intensities from six independent experiments. Data are shown as the mean ± SEM, with statistical analysis performed using the Mann–Whitney test (*P ≤ 0.05). (D) Quantification of total C‐subunit protein expression, normalized to GAPDH, based on band intensities from six independent experiments, as performed in panel C. (E) A representative SDS/PAGE gel from six independent experiments under non‐reducing conditions was used to compare the total expression levels of the dimeric form of RIβ between L50/L50 and L50/L50R patients. (F) Total expression of RIβ protein expression from the gel run in E was quantified based on band intensity from 6 independent experiments. Mann–Whitney test was performed *P ≤ 0.05. Data are presented as the mean ± standard error of the mean (SEM). (G) Quantification of the C‐subunit intensity in the nucleus before and after 30 min of Isoproterenol (ISO) treatment. Each dot represents an individual cell. Data are presented as the mean ± standard error of the mean (SEM), with statistical significance determined using an unpaired t‐test (****P ≤ 0.0001; ns, not significant). Three independent experiments. (H) As in G, but cells were treated with a combination of ISO and Isobutylmethylxanthine (IBMX) for 30 min. Data are presented as the mean ± standard error of the mean (SEM), with statistical significance determined using an unpaired t‐test (*P ≤ 0.05, **P ≤ 0.01, ****P ≤ 0.0001). (I) Representative images from the experiment in H showing patient‐derived cells before and after treatment with 1 μm ISO combined with 200 μm IBMX. DMSO was used as the control treatment. Images were captured 30 min post‐treatment at 63× magnification. Scale bar: 10 μm.
Fig. 3
Fig. 3
Controlling rapid Cα‐subunit translocation into the nucleus by introducing the R211K mutation into the RIβ‐L50R:Cα heterodimer. PC12 cells were co‐transfected to express mCerulean‐Cα along with mKO2‐ RIβ‐WT or mKO2‐ RIβ‐L50R or mKO2‐ RIβ‐L50R + R211K. Cells were imaged before treatment (A) and after treatment with 20 μm Forskolin (FSK) and 200 μm Isobutylmethylxanthine (IBMX) for 30 min (B) or 60 min (C) post fixation. Representative images from three independent experiments taken at 63X magnification are depicted. Scale bar: 10 μm. (D) Live‐cell imaging of PC12 cells co‐transfected to express mCerulean‐Cα along with RIβ‐WT or RIβ‐L50R or RIβ‐L50R + R211K. The cells were imaged every 5 min for 20 min before treatment and after treatment with 20 μm FSK and 200 μm IBMX as denoted in the graph (n = 5). The average fluorescence intensity of Cα in the nucleus was quantified in cells overexpressing the specified constructs. Data are presented as the mean ± standard error of the mean (SEM).
Fig. 4
Fig. 4
Altered PKA holoenzyme dynamics and loss of cooperativity induced by the RIβ‐L50R variant. (A) Illustration of PKA holoenzyme dynamics analyzed by the BRET2 system. GFP2‐tagged Cα and RLuc8‐tagged RIβ are denoted. cAMP is represented by yellow dots. (B, C) BRET2 signal profiles following stimulation of HEK293 cells with either 1 μm Isoproterenol (ISO) (B) or 50 μm Forskolin (FSK) and 100 μm Isobutylmethylxanthine (IBMX) (C). The BRET2 signal was monitored for 20 min. Data represent the BRET2 ratio calculated from the GFP2‐Cα signal (515 nm) divided by the RIβ‐RLuc8 signal (410 nm). RIβ‐G201E/G325E, unable to bind cAMP, served as control. An Rluc8 empty vector was used as a negative control for background luminescence. Each curve represents the mean of six replicates ± standard error of the mean (SEM). (D) cAMP‐mediated PKA holoenzyme activation was determined with a spectrophotometric kinase assay (representative curves). Normalized values for PKA activity were plotted against the logarithmic cAMP concentration. Activation constants (K act) and Hill slopes were determined by applying a sigmoidal dose–response fit (variable slope) and are summarized in the table below (n = number of measurements). The table shows the mean from three independent measurements in duplicate ± standard deviation (SD). Significance was tested with an unpaired t‐test (*P ≤ 0.05, ***P ≤ 0.001). (E) Fluorescence polarization assays measuring cAMP binding to His7‐RIβ‐WT or His7‐RIβ‐L50R (representative curves). Statistical analysis of the sigmoidal dose–response fits (variable slope) showed no significant differences (ns, not significant). All values are presented as the mean of multiple measurements ± SD, where “p” indicates the number of protein preparations and “n” indicates the number of measurements, each performed in duplicate. Significance was assessed using an unpaired t‐test following confirmation of normal distribution.
Fig. 5
Fig. 5
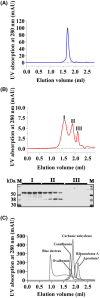
Disrupted dimerization and aggregation tendency of purified RIβ‐L50R proteins. Size‐exclusion chromatography profiles of (A) His7‐RIβ‐WT and (B) His7‐RIβ‐L50R. Western blot analysis of collected fractions from peak I, II, and III of the His7‐RIβ‐L50R using RIβ‐specific antibodies (B). Shown is a representative chromatogram from three independent measurements. (C) Chromatogram of standard proteins used to generate a calibration curve for calculation of Stokes' radii. Blue dextran was used for the determination of the void volume. *Aprotinin was excluded from the calculation of the standard curve.
Fig. 6
Fig. 6
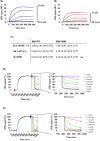
The RIβ‐L50R:Cα holoenzyme requires less cAMP to dissociate, despite high affinity binding to the Cα. (A, B) Binding kinetics of His7‐RIβ‐WT (A) and His7‐RIβ‐L50R (B) to immobilized FSS‐Cα‐subunit measured by surface plasmon resonance (SPR). Six different R‐subunit concentrations from 82.3 pm to 20 nm were used (dilution factor of 3). (C) Kinetic and equilibrium binding constants, determined using a 1 : 1 Langmuir binding fit model (Biacore T200 evaluation software 3.2) are summarized in the table. Values represent the mean ± standard deviation (SD) calculated from at least 3 independent sets of measurements, as denoted in the table (p = number of protein preparation, n = number of measurements). Significance was checked for with a Mann–Whitney test (ns, not significant). (D, E) cAMP‐induced dissociation of RIβ‐subunits from preformed holoenzymes determined by SPR. FSS‐Cα‐subunit was captured on a Strep‐Tactin‐coated CM5 sensor chip. 15 nm His7‐RIβ‐WT (D) or His7‐RIβ‐L50R (E) were injected to the FSS‐Cα‐subunit, reflected in an increase in the SPR signal. cAMP at different concentrations induced RIβ dissociation. Data were normalized at 190 s (0%) and 800 s (100%). Zoomed in sensograms highlight the differences in cAMP‐induced dissociation comparing RIβ‐WT:Cα and RIβ‐L50R:Cα. RU, response units.
Fig. 7
Fig. 7
Differential gene expression analysis of primary human fibroblast cells. Analysis of the transcriptome changes in primary fibroblasts comparing a female patient expressing the RIβ‐L50R variant, diagnosed with a neurodegenerative disorder, and that of a healthy individual, each consisting of four independent cell samples. Analysis was conducted using ShinyGO: Gene Ontology Enrichment Analysis. (A) Volcano plot displaying differential expression. Blue color represents down‐regulated genes while red color represents up‐regulated genes in the affected individual (RIβ‐L50R), as compared to the healthy individual (RIβ‐L50). Genes with a log2foldchange ≥ 1 (corresponding to a multiple hypothesis‐adjusted P‐value (Padj) ≤ 0.05) are highlighted. (B) Heatmap illustrating gene expression patterns. Blue shading indicates down‐regulated genes, and red shading indicates up‐regulated genes in the RIβ‐L50R variant‐expressing subject, as compared to the RIβ‐L50 variant‐expressing subject. Darker shading indicates higher significance. (C) Differentially expressed genes that are up‐ and down‐regulated in the RIβ‐L50R variant‐expressing subject, as compared to the RIβ‐L50 variant‐expressing subject. Pathway classification analysis as denoted (C1‐4). (D) Pathway classification analysis of up‐regulated genes in the RIβ‐L50R variant‐expressing subject, as compared to the RIβ‐L50 healthy individual‐expressing subject (D1‐2). (E) Pathway classification analysis of down‐regulated genes in the RIβ‐L50R variant‐expressing subject, as compared to the RIβ‐L50 healthy individual‐expressing subject (E1‐2). The false discovery rate was calculated based on the nominal P‐value from the hypergeometric test. Fold‐enrichment is defined as the percentage of genes in a list belonging to a pathway, divided by the corresponding percentage in the background.
Fig. 8
Fig. 8
Differential gene expression of cAMP‐related pathway of genes in healthy individuals and RIβ L50R variant carriers. Enrichment analysis of primary fibroblasts from a patient carrying the RIβ‐L50R variant (denoted as L50R) compared to a healthy individual (L50), highlighting genes involved in cAMP‐related pathways. The analysis was conducted using Metascape, selecting genes with a log2foldchange ≥ 1 and an adjusted P‐value (Padj) ≤ 0.05. (A) Schematic representation of the cAMP signaling pathway with the RIβ‐L50R variant positioned at the center of the network. Arrows next to each gene indicate the direction of regulation: upward arrows denote up‐regulated genes, and downward arrows denote down‐regulated genes in L50R cells compared to L50. (B) Heatmap displaying the expression levels of cAMP‐related pathway genes across eight primary fibroblast samples—four from healthy individuals (L50) and four from the L50R variant patient. The heatmap highlights distinct gene expression patterns, with color gradients reflecting relative gene expression levels in each sample. AC, adenylyl cyclase; AKAP, A‐kinase anchoring protein; cAMP, cyclic adenosine monophosphate; GPCR, G protein‐coupled receptor; PDE, phosphodiesterase.
Fig. 9
Fig. 9
Illustration of PKA holoenzyme assembly and dynamics in the healthy and disease state before and in response to cAMP stimulation. Upper panel depicting the inactive state. In the healthy state, the PKA holoenzyme is a dimer of two RIβ:C heterodimers. Homodimerization provides a binding site for AKAPs. In the disease state, PKA exists as a RIβ:C heterodimer, where the L50R mutant perturbs homodimerization and AKAP binding. The bars in the illustration represent RIβ expression levels and the ratio between monomers and dimers. The lower panel depicts PKA dynamics upon cAMP‐induced activation. In the healthy state, the RIβ dimer dissociates from the C‐subunit, allowing its translocation into the nucleus. In the disease state, the RIβ‐L50R:C heterodimer dissociates faster, exhibits reduced cooperativity, leads to RIβ aggregation, and promotes faster translocation of the C‐subunit into the nucleus. cAMP, cyclic adenosine monophosphate; CNB, cyclic nucleotide‐binding domain; D/D, dimerization and docking domain.

References

    1. Cadd G & McKnight GS (1989) Distinct patterns of cAMP‐dependent protein kinase gene expression in mouse brain. Neuron 3, 71–79. - PubMed
    1. Kandel ER (2012) The molecular biology of memory: cAMP, PKA, CRE, CREB‐1, CREB‐2, and CPEB. Mol Brain 5, 14. - PMC - PubMed
    1. Abel T, Nguyen PV, Barad M, Deuel TA, Kandel ER & Bourtchouladze R (1997) Genetic demonstration of a role for PKA in the late phase of LTP and in hippocampus‐based long‐term memory. Cell 88, 615–626. - PubMed
    1. Huang YY, Kandel ER, Varshavsky L, Brandon EP, Qi M, Idzerda RL, McKnight GS & Bourtchouladze R (1995) A genetic test of the effects of mutations in PKA on mossy fiber LTP and its relation to spatial and contextual learning. Cell 83, 1211–1222. - PubMed
    1. Ma L, Day‐Cooney J, Benavides OJ, Muniak MA, Qin M, Ding JB, Mao T & Zhong H (2022) Locomotion activates PKA through dopamine and adenosine in striatal neurons. Nature 611, 762–768. - PMC - PubMed

MeSH terms

Substances