. 2025 Apr 1;26(7):3267.
doi: 10.3390/ijms26073267.

Growth Hormone-Releasing Hormone Antagonists Increase Radiosensitivity in Non-Small Cell Lung Cancer Cells

Affiliations

Growth Hormone-Releasing Hormone Antagonists Increase Radiosensitivity in Non-Small Cell Lung Cancer Cells

Iacopo Gesmundo et al. Int J Mol Sci. .

Abstract

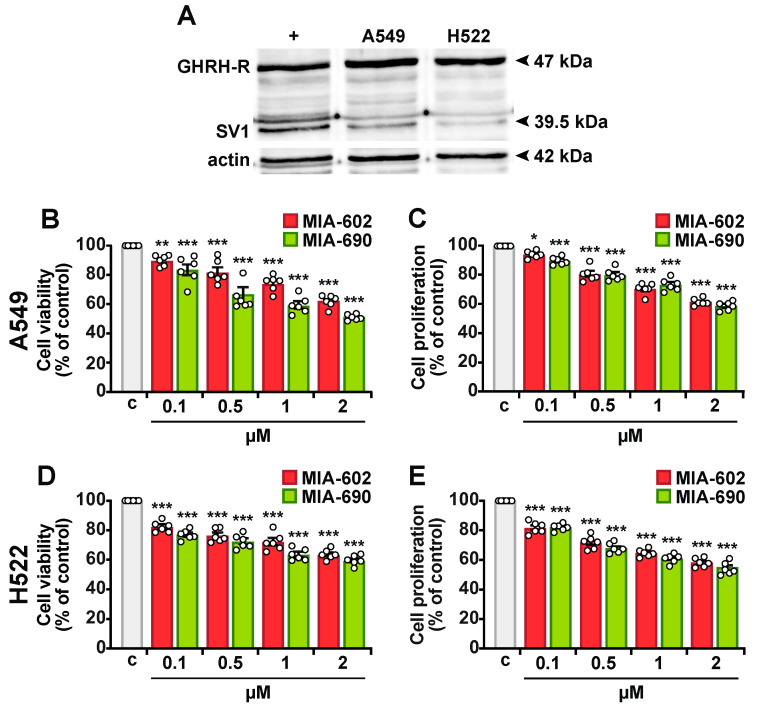
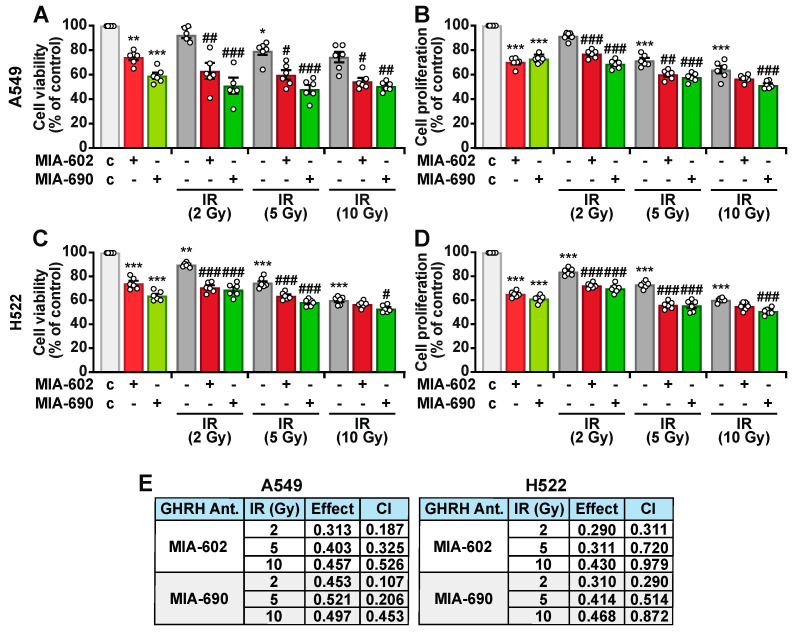
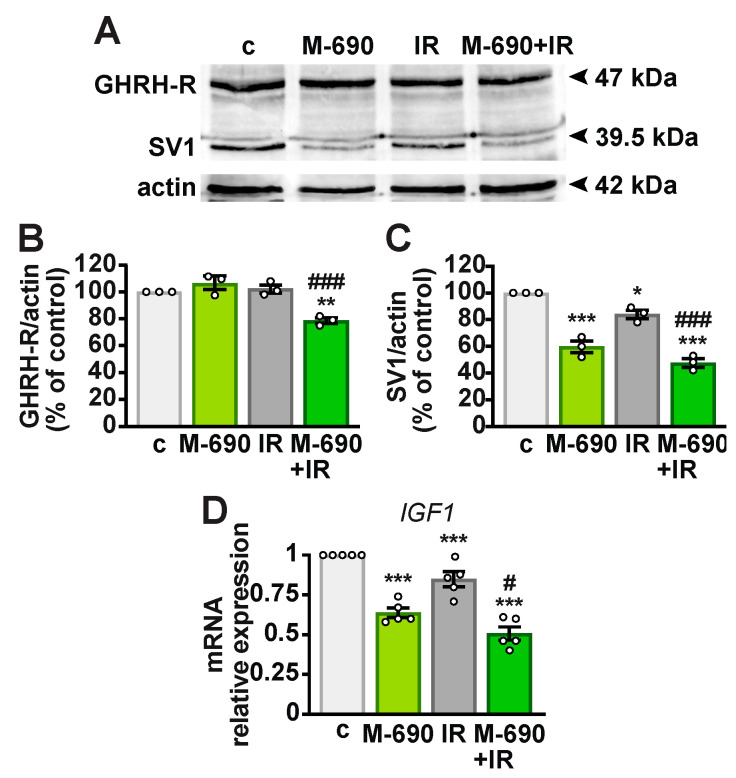
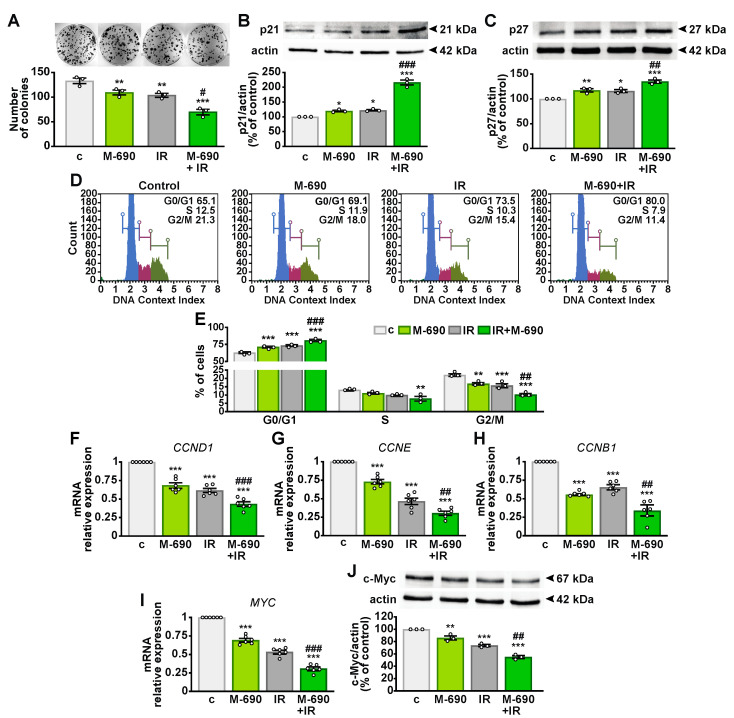
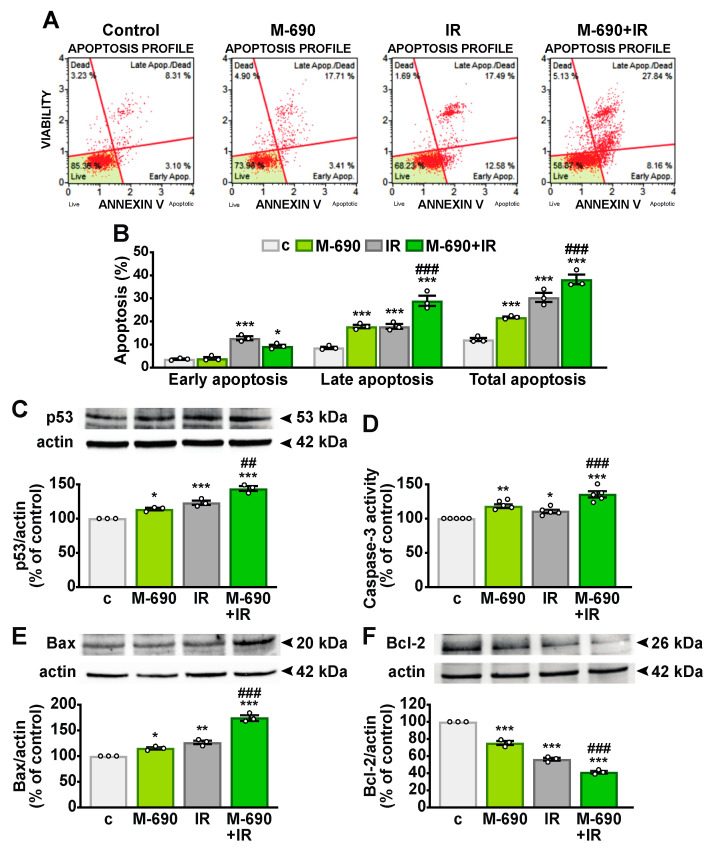
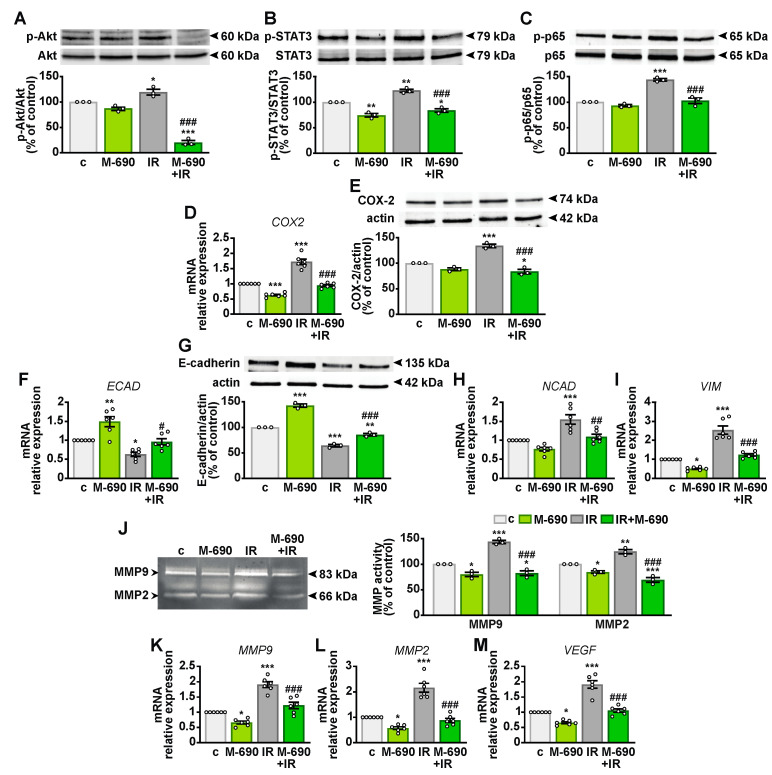
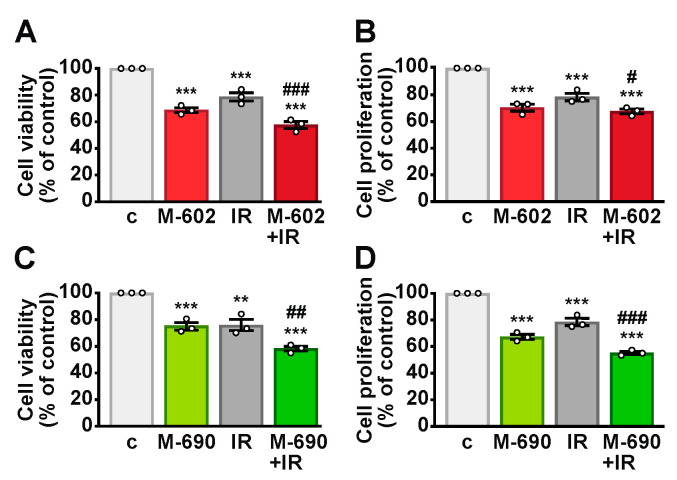
Growth hormone-releasing hormone (GHRH) antagonists exert antitumor functions in different experimental cancers. However, their role in combination with radiotherapy in non-small cell lung cancer (NSCLC) remains unknown. Therefore, we investigated the radiosensitizing effect of GHRH antagonists in NSCLC. A549 and H522 NSCLC cell lines were exposed to ionizing radiation (IR) and GHRH antagonists MIA-602 and MIA-690, either individually or in combination. Cell viability and proliferation were evaluated by MTT, BrdU, flow cytofluorimetry, and clonogenic assays; gene and protein expression, signaling pathways, and apoptosis were analyzed by real-time PCR, Western blot, annexin staining, and caspase-3 assay. GHRH antagonists showed antitumor effects alone and potentiated IR-induced inhibition of cell viability and proliferation. The combination of MIA-690 and IR decreased the expression of GHRH receptor, its oncogenic splice variant 1, and IGF1 mRNA levels. Additionally, cell cycle inhibitors and proapoptotic markers were upregulated, whereas cyclins, oncogenic MYC, and the antiapoptotic protein Bcl-2 were downregulated. Radioresistance was prevented by MIA-690, which also blunted epithelial-mesenchymal transition by enhancing E-cadherin and reducing mesenchymal, oxidative, and proangiogenic effectors. Finally, both MIA-602 and MIA-690 enhanced radiosensitivity in primary human NSCLC cells. These findings highlight the potential of GHRH antagonists as radiosensitizers in NSCLC treatment.

Keywords: GHRH; GHRH antagonists; NSCLC; ionizing radiation; radiosensitivity.


Conflict of interest statement

R.C., X.Z. and W.S. are co-inventors on the patents for GHRH analogs, assigned to the University of Miami and Veterans Affairs Medical Center. The remaining authors declare no conflicts of interest.

Figures

Figure 1
Figure 1
Expression of GHRH-Rs and inhibitory effect of MIA-602 and MIA-690 in NSCLC cells. (A) Western blot analysis of GHRH-R and SV1 in A549 and H522 cells. PC3 human prostate cancer cells served as a positive control (+), while actin was used as internal control. Cell viability and proliferation assessed by MTT and BrdU assays, respectively, in A549 (B,C) and H522 (D,E) cells, either untreated (c, control) or treated with MIA-602 or MIA-690 for 24 h at the indicated concentrations. Results, expressed as a percentage of control, are means ± SEM. * p < 0.05, ** p < 0.01, *** p < 0.001 vs. c, by one-way ANOVA and Dunnett’s multiple comparison post hoc test (n = 6).
Figure 2
Figure 2
Radiosensitizing effect of MIA-602 and MIA-690 in NSCLC cells. Cell viability and proliferation assessed by MTT and BrdU assays, respectively, in A549 (A,B) and H522 (C,D) cells, either left untreated (c, control) or treated with the indicated doses of IR, alone or in combination with 1 μM MIA-602 or MIA-690 for 24 h. Results, expressed as percentage of control, are means ± SEM. * p < 0.05, ** p < 0.01, *** p < 0.001 vs. c; # p < 0.05, ## p < 0.01, ### p < 0.001 vs. the corresponding IR dose by one-way ANOVA and Tukey’s multiple comparison post hoc test (n = 6). (E) Combination index (CI) values, calculated with CompuSyn software (www.combosyn.com), for 1 μM MIA-602 or MIA-690 with the indicated IR doses on cell viability inhibition in A549 and H522 cells.
Figure 3
Figure 3
Reduction in GHRH-Rs and IGF1 expression in A549 cells treated with MIA-690 and IR combination. (A) Representative immunoblot analysis of GHRH-R and SV1 after 24 h of treatment. Cells were either untreated (c, control) or exposed to 5 Gy IR, 1 μM MIA-690 (M-690), or their combination. Graphs show the densitometric quantification of GHRH-R (B) and SV1 (C) normalized to actin and expressed as a percentage of the control. Data are means ± SEM. * p < 0.05, ** p < 0.01, *** p < 0.001 vs. c; ### p < 0.001 vs. IR, by one-way ANOVA and Tukey’s multiple comparison post hoc test (n = 3). (D) IGF1 mRNA levels were measured by real-time PCR, normalized to 18S rRNA, and expressed as means ± SEM. *** p < 0.001 vs. c; # p < 0.05 vs. IR, by one-way ANOVA and Tukey’s multiple comparison post hoc test (n = 5).
Figure 4
Figure 4
Inhibitory effects of MIA-690 and IR combination on colony formation and cell cycle regulators. (A) Representative colony formation assay in A549 cells, either untreated (c, control) or cultured for 10 days following exposure to a single dose of 5 Gy IR and 1 μM MIA-690 (M-690), (n = 3). Representative immunoblot analysis of p21 (B) and p27 (C) protein expression (top panels) in A549 cells treated for 24 h with 1 µM MIA-690, 5 Gy IR, or their combination. Actin was used as a loading control (bottom panels). Graphs represent densitometric analysis normalized to actin and expressed as a percentage of control. Data (AC) are means ± SEM (n = 3). * p < 0.05, ** p < 0.01, *** p < 0.001 vs. c; # p < 0.05, ## p < 0.01, ### p < 0.001 vs. IR, by one-way ANOVA and Tukey’s post hoc test. (D) Representative flow cytometry images illustrating cell cycle distribution [G0/G1 (blue), S (magenta), and G2/M (green) phases] in A549 cells treated for 24 h with 1 μM MIA-690, 5 Gy IR, or their combination, using the Muse™ Cell Cycle kit. (E) Quantification of the percentage of cells in each phase, expressed as mean ± SEM (n = 3). ** p < 0.01, *** p < 0.001 vs. c; ## p < 0.01, ### p < 0.001 vs. IR in each phase, by two-way ANOVA and Tukey’s post hoc test. (FI) mRNA expression levels of cyclin D1 (CCND1) (F), cyclin E (CCNE) (G), cyclin B1 (CCNB1) (H), and MYC (I) assessed by real-time PCR in A549 cells treated for 24 h with 1 μM MIA-690, 5 Gy IR, or their combination. Expression levels are normalized to 18S rRNA and are means ± SEM (n = 6). *** p < 0.001 vs. c; ## p < 0.01, ### p < 0.001 vs. IR, by one-way ANOVA and Tukey’s post hoc test. (J) Representative immunoblot analysis of c-Myc expression (top panel) in A549 cells treated for 24 h with 1 μM MIA-690, 5 Gy IR, or their combination. Actin was used as a loading control (bottom panel). The graph shows densitometric analysis normalized to actin and expressed as a percentage of control. Data are means ± SEM (n = 3). ** p < 0.01, *** p < 0.001 vs. c; ## p < 0.01 vs. IR, by one-way ANOVA and Tukey’s post hoc test.
Figure 5
Figure 5
Proapoptotic effect of MIA-690 and IR combination in NSCLC cells. A549 cells were either left untreated (c, control) or treated with 1 μM MIA-690 (M-690) and/or exposed to 5 Gy IR, alone or in combination, for 24 h. (A) Representative flow cytometry results using the Muse™ Annexin V and Dead Cell assay in A549 cells. (B) Quantification of early apoptosis, late apoptosis, and total apoptosis (early + late) in Annexin V-stained cells. Results are means ± SEM. * p < 0.05 and *** p < 0.001 vs. c; ### p < 0.001 vs. IR, by two-way ANOVA and Tukey’s post hoc test. (C) Representative Western blot of p53 protein (top), with actin used as loading control (bottom). (D) Apoptosis assessment via caspase-3 activity. (E,F) Western blot analysis of Bax (E) and Bcl-2 (F) expression. Graphs show the densitometric analysis of p53 (C), Bax (E), and Bcl-2 (F) levels, normalized to actin, and expressed as a percentage of the control. Data are means ± SEM. * p < 0.05, ** p < 0.01, and *** p < 0.001 vs. c; ## p < 0.01, ### p < 0.001 vs. IR, by one-way ANOVA and Tukey’s post hoc test (n = 3 for B,C,E,F; n = 5 for D).
Figure 6
Figure 6
Inhibitory effects of MIA-690 on radioresistance and radiation-induced EMT in A549 cells. Cells were either untreated (c, control), treated with 1 μM MIA-690 (M-690), exposed to 5 Gy IR, or subjected to a combination of both treatments for 24 h. (AC) Representative Western blots showing phosphorylated Akt (p-Akt) (A), STAT3 (p-STAT3) (B), and p65 (p-p65) (C) (top panels). Blots were reprobed with antibodies against total proteins for normalization (bottom panels), with results expressed as percentage of the control (n = 3). (D) COX2 mRNA levels assessed by real-time PCR and normalized to 18S rRNA (n = 6). (E) COX-2 protein expression analyzed by Western blot (top panel), with actin used as a loading control (bottom panel) (n = 3). (F) E-cadherin (ECAD) mRNA levels assessed by real-time PCR and normalized to 18S rRNA (n = 6). (G) Western blot analysis of E-cadherin expression (top panel), with actin used as a loading control (bottom panel), (n = 3). Densitometric analysis of COX-2 (E) and E-cadherin (G) protein levels, normalized to actin and expressed as a percentage of the control, is shown in the accompanying graphs. (H,I) mRNA levels of N-cadherin (NCAD) (H) and vimentin (VIM) (I) measured by real-time PCR and normalized to 18S rRNA (n = 6). (J) Representative gelatin zymography of MMP9 and MMP2 activity in A549-conditioned medium. The graph presents densitometric analysis of MMP9 and MMP2 activity as a percentage of the control (n = 3). (KM) MMP9 (K), MMP2 (L), and VEGF (M) levels analyzed by real-time PCR and normalized to 18S rRNA (n = 6). Data are means ± SEM. * p < 0.05, ** p < 0.01, and *** p < 0.001 vs. c; # p < 0.05, ## p < 0.01, and ### p < 0.001 vs. IR, by one-way ANOVA and Tukey’s post hoc test.
Figure 7
Figure 7
Radiosensitizing effect of GHRH antagonists in primary NSCLC cells. Cell viability (A,C) and proliferation (B,D) assessed by MTT and BrdU assay, respectively, in untreated control cells (c) and in cells exposed to 5 Gy IR followed by treatment for 24 h with 1 μM MIA-602 (M-602) (A,B) or MIA-690 (M-690) (C,D), either alone or in combination. Results, expressed as a percentage of the control, are means ± SEM. ** p < 0.01, *** p < 0.001 vs. c; # p < 0.05, ## p < 0.01, ### p < 0.001 vs. IR, by one-way ANOVA and Tukey’s multiple comparison post hoc test (n = 3).

Similar articles

References

    1. Sung H., Ferlay J., Siegel R.L., Laversanne M., Soerjomataram I., Jemal A., Bray F. Global Cancer Statistics 2020: GLOBOCAN Estimates of Incidence and Mortality Worldwide for 36 Cancers in 185 Countries. CA Cancer J. Clin. 2021;71:209–249. doi: 10.3322/caac.21660. - DOI - PubMed
    1. Tan A.C., Tan D.S.W. Targeted Therapies for Lung Cancer Patients with Oncogenic Driver Molecular Alterations. J. Clin. Oncol. 2022;40:611–625. doi: 10.1200/JCO.21.01626. - DOI - PubMed
    1. Herbst R.S., Morgensztern D., Boshoff C. The biology and management of non-small cell lung cancer. Nature. 2018;553:446–454. doi: 10.1038/nature25183. - DOI - PubMed
    1. Wang Y., Liu Z.G., Yuan H., Deng W., Li J., Huang Y., Kim B.Y.S., Story M.D., Jiang W. The Reciprocity between Radiotherapy and Cancer Immunotherapy. Clin. Cancer Res. 2019;25:1709–1717. doi: 10.1158/1078-0432.CCR-18-2581. - DOI - PMC - PubMed
    1. Zhou T., Zhang L.Y., He J.Z., Miao Z.M., Li Y.Y., Zhang Y.M., Liu Z.W., Zhang S.Z., Chen Y., Zhou G.C., et al. Review: Mechanisms and perspective treatment of radioresistance in non-small cell lung cancer. Front. Immunol. 2023;14:1133899. doi: 10.3389/fimmu.2023.1133899. - DOI - PMC - PubMed

MeSH terms