. 2025 Apr 1;26(7):3285.
doi: 10.3390/ijms26073285.

Depletion of Cell Adhesion Molecule L1 from Microglia and Macrophages Reduces Recovery After Spinal Cord Injury

Affiliations

Depletion of Cell Adhesion Molecule L1 from Microglia and Macrophages Reduces Recovery After Spinal Cord Injury

Thomas Theis et al. Int J Mol Sci. .

Abstract

The young mammalian central nervous system regenerates after spinal cord injury and recovers locomotion, whereas adult mice only show limited recovery that depends on the injury severity, genetic background, and physical therapy. At the molecular level, key regulators that contribute to recovery are cell adhesion molecules, such as L1CAM (L1). At the cell surface, L1 functions as a homotypic receptor that signal-transduces crucial functions in neuronal migration and survival, neurite outgrowth, myelination, formation of synapses, and synaptic plasticity. In the adult central nervous system, L1 is expressed only by neurons. We now show that L1 is unexpectedly also expressed by 26% microglia, freshly isolated from a 7-day-old mouse brain. At postnatal day 21, only 3% of microglia are L1-positive. Using a mouse mutant in which L1 is deleted specifically in monocytes of 10- to 14-week-old mice, functional recovery was reduced up to 4 weeks after injury at lower thoracic spinal levels. Also, NF200-immunoreactive and 5-HT-immunoreactive fibers were found decreased below the injury site as compared to wild-type mice. In conclusion, microglial cells that express L1 stimulate neurite outgrowth in vitro, improve functional recovery after spinal cord injury in adult mice, and increase fiber densities caudal to the lesion site.

Keywords: Basso mouse scale; L1CAM; functional recovery; microglia; spinal cord injury.


Conflict of interest statement

The authors declare no conflicts of interest.

Figures
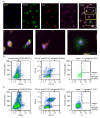
Figure 1
Figure 1
A subpopulation of microglia expresses L1: (A) Representative images of cultured microglial cells stained for the microglia markers CD11b (green) and Iba1 (red), for L1 (violet) and cell nuclei (DAPI, blue). The merged images show a subpopulation of microglia expressing L1. The white box numbered with 1 indicates the enlarged area with cells that highly express L1, the yellow box numbered with 2 indicates the enlarged area with cells that moderately express L1, and the orange box numbered with 3 indicates the enlarged area with cells that do not express L1. Scale bars = 30 µm. (B,C) Flow cytometry of freshly isolated microglia from pooled brains of 7-day-old mice of both sexes (n = 1, (B)) and 21-day-old mice of both sexes (n = 1, (C)). The gates were set to identify the microglia population. All microglia show lower expression of CD45 (left scatter plots) and higher expression of CD11b. P2Y12 is only expressed by microglia and not by infiltrating macrophages (middle scatter plots). The scatter plots in the panel on the right side show the percentage of microglial cells that express L1. Color gradients in the scatter plots are representing the density of cells in different regions of the plot. Blue dots indicate a low cell number, green dots indicate a moderate cell number, and red dots indicate a high cell number.
Figure 2
Figure 2
Antagonistic L1 antibody reduces microglial cell migration: (A) Representative images of confluent microglial cells from three experiments at 0 h and 24 h after scratch injury. Dotted lines mark the edges of the scratch. Scale bar = 100 µm. (B) The bar diagram shows the % average gap closure (n = 6 from three independent experiments, error bars indicate SD) and individual data points from all experimental groups (circle: untreated (-), square: IgG treated (IgG), triangle: L1 function-triggering antibody treated (AB 557), inverted triangle: L1 function blocking antibody treated (AB 324)). Data were analyzed using one-way ANOVA followed by post hoc Fisher’s protected least significant difference test. * p < 0.05.
Figure 3
Figure 3
(A) Representative images from three experiments of cerebellar granule cells cultured either alone (Only neurons) or co-cultured with L1-negative (L1 )or L1-positive (L1) microglia. Scale bars = 30 µm. Black boxes indicate the areas that were enlarged. The red lines in the enlarged images show examples of neurites. (B) Control L1-positive microglial cells enhance neurite outgrowth of co-cultured cerebellar granule cells. The bar diagram shows the average longest neurite length of cerebellar granule cells in co-cultures (n = 6 from three independent experiments) and individual data points from all experimental groups (circle: no microglia co-culture, i.e., only neurons, and treated with IgG (-), square: L1+ microglia co-culture and treated with IgG, triangle: L1 microglia co-culture and treated with IgG, inverted triangle: no microglia co-culture and treated with L1 function blocking antibody 324, diamond: L1+ microglia co-culture and treated with L1 function blocking antibody 324, circle: L1 microglia co-culture and treated with L1 function blocking antibody 324). Data were analyzed using one-way ANOVA followed by post hoc Fisher’s protected least significant difference test and shown as mean ± SD. * p <0.05.
Figure 4
Figure 4
Subpopulations of L1-expressing monocytes in the adult healthy and injured spinal cords: (A,B) Flow cytometry of freshly isolated microglial cells from (A) non-injured (n = 1) and (B) injured pooled spinal cords of 10-week-old mice of both sexes (n = 1). Microglia-specific gates were set as described in Figure 1 (left and middle scatter plots). The right scatter plots show the size and the percentage of microglial cells that express L1. Color gradients in the scatter plots are representing the density of cells in different regions of the plot. Blue dots indicate a low cell number, green dots indicate a moderate cell number, and red dots indicate a high cell number.
Figure 5
Figure 5
Mice with L1-depleted monocytes show reduced recovery after SCI. In the experimental group, homozygous L1 flox mice were crossed with heterozygous CX3CR1-creER mice L1 in which cre-recombinase expression was controlled by the monocyte-specific CX3CR1 promotor. After tamoxifen treatment, the experimental group contains L1-depleted monocytes. For control, homozygous L1 flox mice were treated with tamoxifen, indicating the presence of L1 in monocytes. The diagram shows the average BMS scores and individual data points of the two groups. Data are presented as mean ± SD (n = 6 mice/group). Statistical analysis was performed using repeated measures ANOVA.
Figure 6
Figure 6
The lesion volume does not differ between the experimental groups without L1-expressing monocytes and wild-type littermates: (A) Representative images from three different animals per group show immunostainings of sagittal spinal cord sections that contain the lesion in the center. The green channel represents GFAP staining for astrocytes, the red channel represents Iba1 staining for monocytes, and the purple channel represents MBP staining for myelin. (B) The bar diagram shows the average volume of GFAP negative staining in the lesion, Iba1-positive filling of the lesion, and lack of myelin (MBP staining) around the lesion and individual data points from all experimental groups (circle: L1+/+ mice, square: Cre+/− with L1+/+ mice). Data are presented as mean ± SD (n = 5 mice/group). Data were analyzed using Student’s t-test. p > 0.05; ns—not significant difference.
Figure 7
Figure 7
Increased numbers of NF200-immunoreactive and 5HT-immunoreactive fibers caudal to the lesion in wild-type mice compared to mice with L1-negative microglia: (A) Representative images show immunostainings in sagittal spinal cord sections with lesions in the center. The green channel shows the GFAP staining to identify the lesion, the purple channel represents NF200 staining, and the red channel represents 5-HT staining. The dotted lines on the right side indicate the caudal lesion edge. The dotted lines on the left side indicate the site where fibers were counted. The dotted box indicates the area that was zoomed in to show representative areas of fibers. The red arrows indicate 5HT-positive fibers, and the purple arrows indicate NF200-positive fibers. Scale bars = 200 µm. (B) The bar diagram shows the average numbers of NF200-immunoreactive and 5-HT-immunoreactive fibers and individual data points from all experimental groups (circle: L1+/+ mice, square: Cre+/− with L1+/+ mice). Data are presented as mean ± SD (n = 5 mice/group) and were analyzed using Student’s t-test. * p <0.05 and ** p < 0.01.

References

    1. Chen Y., Tang Y., Vogel L.C., Devivo M.J. Causes of Spinal Cord Injury. Top. Spinal Cord Inj. Rehabil. 2013;19:1–8. doi: 10.1310/sci1901-1. - DOI - PMC - PubMed
    1. Selvarajah S., Hammond E.R., Haider A.H., Abularrage C.J., Becker D., Dhiman N., Hyder O., Gupta D., Black J.H., Schneider E.B. The Burden of Acute Traumatic Spinal Cord Injury among Adults in the United States: An Update. J. Neurotrauma. 2014;31:228–238. doi: 10.1089/neu.2013.3098. - DOI - PubMed
    1. Xiao Z., Tang F., Tang J., Yang H., Zhao Y., Chen B., Han S., Wang N., Li X., Cheng S., et al. One-Year Clinical Study of NeuroRegen Scaffold Implantation Following Scar Resection in Complete Chronic Spinal Cord Injury Patients. Sci. China Life Sci. 2016;59:647–655. doi: 10.1007/s11427-016-5080-z. - DOI - PubMed
    1. Zhu H., Poon W., Liu Y., Leung G.K.-K., Wong Y., Feng Y., Ng S.C.P., Tsang K.S., Sun D.T.F., Yeung D.K., et al. Phase I–II Clinical Trial Assessing Safety and Efficacy of Umbilical Cord Blood Mononuclear Cell Transplant Therapy of Chronic Complete Spinal Cord Injury. Cell Transplant. 2016;25:1925–1943. doi: 10.3727/096368916X691411. - DOI - PubMed
    1. Sytnyk V., Leshchyns’ka I., Schachner M. Neural Cell Adhesion Molecules of the Immunoglobulin Superfamily Regulate Synapse Formation, Maintenance, and Function. Trends Neurosci. 2017;40:295–308. doi: 10.1016/j.tins.2017.03.003. - DOI - PubMed

Substances

LinkOut - more resources