. 2025 Aug;14(20):e2500551.
doi: 10.1002/adhm.202500551. Epub 2025 Apr 17.

Dendrimer Conjugates with PD-L1-Binding Peptides Enhance In Vivo Antitumor Immune Response

Affiliations

Dendrimer Conjugates with PD-L1-Binding Peptides Enhance In Vivo Antitumor Immune Response

DaWon Kim et al. Adv Healthc Mater. 2025 Aug.

Abstract

Peptides are an emerging class of biologics for cancer immunotherapy; however, their clinical translation is hindered by poor binding kinetics, bioavailability, and short plasma half-life compared to their corresponding antibodies. Nanoparticles present potential solutions but face scale-up difficulties due to complexity. Here, a translatable, modular nanoparticle scaffold is presented for peptide-based immune checkpoint inhibitors (ICIs). This platform is based on a simple structure of generation 7 (G7) poly(amidoamine) (PAMAM) dendrimers conjugated with engineered peptides (dendrimer-peptide conjugates, DPCs). DPCs functionalized with multiple copies of a programmed death-ligand 1 (PD-L1)-binding peptide exhibited significantly enhanced avidity-based binding kinetics and in vitro specificity, in addition to the substantially prolonged plasma half-life in vivo. Notably, a series of in vivo experiments revealed that DPCs displayed selective tumor accumulation and high efficacy, without apparent toxicity, when applied to a syngeneic mouse model bearing mouse oral carcinoma (MOC1) tumors. The results indicate that the DPC platform significantly improves the antagonistic effect and in vivo behaviors of the PD-L1-binding peptides, which can be potentially applied to virtually any peptide-based ICIs. The DPC platform's simplicity and modular nature will likely increase the potential of its clinical translation and ultimately enable precision/personalized cancer immunotherapy.

Keywords: Cancer immunotherapy; PD‐L1‐ binding peptide; dendrimer; immune checkpoint inhibitor; multivalent biding.


Conflict of interest statement

The authors declare no conflict of interest.

Figures

Scheme 1
Scheme 1
Schematic illustrating the hypothesis that multivalent binding effects mediated by dendrimers would increase the antagonistic effect of peptide‐based immune checkpoint inhibitors (ICIs), thus leading to enhanced immune responses and tumor cell death.
Figure 1
Figure 1
Synthesis and characterization of G7‐pPD‐L1 conjugates. a) 3‐D illustration of DPC preparation, displaying the isolation of a mouse PD‐L1‐binding peptide (pPD‐L1m) sequence and its conjugation to a G7 PAMAM dendrimer, resulting in a dendrimer‐peptide conjugate (DPC). b) Schematic diagram illustrating the synthetic route of the Cy5.5‐labeled DPCs. c) 1H NMR spectra of the Cy5.5‐labeled DPCs. The spectra show amine‐terminated G7 PAMAM dendrimers (G7‐NH2), Cy5.5‐labeled G7‐NH2 (G7‐Cy5.5‐NH2), partially acetylated G7‐Cy5.5‐NH2 (G7‐pAc‐NH2), G7‐pAc‐NH2 after carboxylation (G7‐pAc‐COOH), free pPD‐L1, and DPC from top to bottom. d) TEM images observing morphology and size of the G7 PAMAM dendrimers before (G7‐pAc‐COOH) and after (DPC) conjugation with pPD‐L1. Particle size analysis (right) indicates that the diameter of G7‐pAc‐COOH and DPC are 13.6 ± 2.1 nm and 17.8 ± 2.3 nm, respectively (n = 15). Scale bar, 100 nm. e) Hydrodynamic size distributions measured via DLS. The Hydrodynamic sizes of amine‐terminated G7 PAMAM dendrimer (G7), acetylated G7 (G7‐pAc), G7‐pAc after carboxylation (G7‐pAc‐COOH), and DPC were measured as 6.85 ± 0.53 nm, 8.00 ± 0.65 nm, 8.48 ± 0.53 nm, and 13.34 ± 2.46 nm, respectively (n = 5). f) Kinetic characterization of aPD‐L1, pPD‐L1, and DPC using BLI. The table (right) shows the association rate constant (k a), dissociation rate constant (k d), and affinity constant (equilibrium dissociation constant, K D) of the samples of the mouse PD‐L1 protein. Error bars represent the mean ± SEM. Statistical significance for the TEM measurements was analyzed using a two‐tailed t‐test, while significance for the DLS measurements was determined using a one‐way ANOVA followed by Bonferroni's multiple comparison post‐test, with the G7 group serving as the control (*< 0.033, **< 0.002, ***< 0.001).
Figure 2
Figure 2
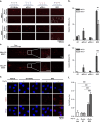
Cell binding and selectivity of the DPC using PD‐L1High MOC1 and PD‐L1Low SCC7 cells. a) Images of surface‐captured DiD‐stained cells (indicated by white circles) before and after washing at high shear stress (1.44 dyn cm−2). Scale bar, 500 µm. b) Retention efficiency of the cells on the surfaces functionalized with fully acetylated G7 PAMAM dendrimers (G7), aPD‐L1, pPD‐L1, and DPCs (n = 3 for each group). c) Representative images of MOC1 and SCC7 cells captured on the surfaces immobilized with DPCs underflow at low shear stress (0.36 dyn cm−2). Scale bar, 1 mm. d) Capture the efficiency of the cells on the four different surfaces (n = 3 for each group). Note that the DPC‐functionalized surface exhibits the highest retention and capture efficiencies in a manner dependent upon the PD‐L1 expression of the cells. e) Confocal microscopy images of MOC1 cells upon 3‐hours treatments with either G7 or DPCs (both labeled with Cy5.5). Free pPD‐L1 was pre‐treated (Pre‐Tx) for 1 h to block PD‐L1 binding for a competition assay. Scale bar, 30 µm. f) PD‐L1‐expressing MOC1 cell specificity of DPC quantified from the mean fluorescence intensity (MFI) of the Cy5.5 signals on confocal images (n = 6 per group). The error bars represent the mean ± SEM. For retention and capture efficiency, statistical significance was analyzed using two‐way ANOVA followed by Bonferroni's multiple comparison post‐test, comparing MOC1 to SCC7 within each surface group. The statistical significance for confocal microscopy assays was analyzed using one‐way ANOVA followed by Bonferroni's multiple comparison post‐test (*p < 0.033, **p < 0.002, ***p < 0.001).
Figure 3
Figure 3
Plasma stability and serum half‐life of DPCs. a) A scheme of the plasma stability test measuring the serum half‐lives of pPD‐L1 and DPC. b) Fluorescence intensities of either Cy5.5‐labeled DPCs or pPD‐L1 (DPC‐Cy5.5, pPD‐L1‐Cy5.5) in serum of C57BL/6 mice at various time points (Color scale: Min 1.67e7, Max 1.00e8). c) Exponential decay plot showing drug elimination of DPC‐Cy5.5 and pPD‐L1‐Cy5.5 over time. Each data point represents the mean fluorescence intensity measured with error bars indicating the standard error of the mean. The curve represents an exponential decay curve fitted to the data (n = 4 mice per time point).
Figure 4
Figure 4
In vivo efficacy of DPCs in a MOC1 syngeneic mouse model. a‐c) Comparison of antitumor efficacy of MOC1 tumor‐bearing mice treated with PBS (vehicle), non‐functionalized G7 PAMAM dendrimer (G7), or DPC in three different dosages of 10, 25, and 50 mpk (n = 10 per group). a) A timeline of the study and tumor volume change plot before and after the injections. b) Body weight changes after the start of injections (n = 5 per group). c) Spaghetti plots showing individual mouse responses following the initiation of injections with 50 mpk of G7 PAMAM dendrimer (left) or DPC (right). d‐f) Comparison of antitumor efficacy of MOC1 tumor‐bearing mice treated with PBS (vehicle), aPD‐L1 (1.5 mpk), or DPC (3.7 and 50 mpk) (n = 8 per group). d) A timeline of the study and tumor volume change plot post the initiation of drug administrations. e) Body weight changes throughout the administration (n = 4 per group). f) Spaghetti plots demonstrating individual mouse responses of all four groups throughout four injections. g) Representative IVIS images of MOC1 tumor‐bearing mice after one and four weeks from the seventh administration of G7 PAMAM dendrimer (G7‐100‐Ac) or DPC in three different doses: 10, 25, and 50 mpk (Please refer to Figure S8 (Supporting Information) for the quantification). The white circles indicate drug accumulation in the tumor site. Arrows indicate the drug administration. The error bars represent the mean ± SEM. The statistical significance was analyzed by two‐way ANOVA with Bonferroni's multiple comparison post‐test (*p < 0.033, **< 0.002, ***p < 0.001).
Figure 5
Figure 5
Immunohistochemical and flow cytometry studies of MOC1 tumor tissues after drug administration. a) Representative images of immunohistochemical (IHC) staining with CD4, CD8a, FoxP3, and PCNA (brown chromogen indicated by arrows) in MOC1 tumor tissue samples after seven doses of saline (vehicle), G7 PAMAM dendrimer (G7), aPD‐L1, pPD‐L1, and DPCs. Hematoxylin and eosin‐staining (H&E) were conducted as controls. See Figure S10 (Supporting Information) for the complete set of the images. Scale bar, 2 mm. b) Quantitative data showing CD4‐, CD8a‐, FoxP3‐, and PCNA‐positive expressions based on the immunohistochemical images. CD8a+/FoxP3+ and CD4+/FoxP3+ ratios for paired tumor tissues were calculated. c) Schematic illustration of flow cytometry study (top) and proportions of CD4+ helper T cells (CD4+CD8a in CD3+ cells), CD8+ cytotoxic T cells (CD8a+CD4 in CD3+ cells), regulatory T cells (CD25+FoxP3+ in CD3+ cells), activated cytotoxic T cells (CD25+ in CD8a+CD4 cells), and effector T cells (CD44+CD62L in CD8a+CD4 cells) in tumor tissues after IV injections of saline (vehicle), G7 PAMAM dendrimer (G7), aPD‐L1, pPD‐L1, and DPCs, as measured by flow cytometry. The ratio of CD8a+/Treg, calculated based on the flow cytometry data, is also presented. The error bars represent the mean ± SEM (n = 9 for b; n = 8 for c). Statistical significance was analyzed using a one‐way ANOVA followed by Bonferroni's multiple comparison post‐test, with the vehicle group serving as the control (*p < 0.033, **p < 0.002, ***p < 0.001).
Figure 6
Figure 6
NanoString nCounter analysis on MOC1 tumor tissues after DPC treatment. a) Heatmap of significantly altered immune‐related genes between saline (vehicle) and DPC treatment groups (Full heatmap for all treatment groups available in Figure S12, Supporting Information). Red and blue colors represent upregulated and downregulated genes, respectively. b) Volcano plot showing changes in gene expression profiles of DPC‐treated tumors. The dotted lines indicate p <0.05. Green dots represent significantly upregulated genes, and purple dots represent significantly downregulated genes, compared to vehicles. c) Gene expressions that were significantly upregulated (top) or downregulated (bottom) after DPC treatments compared to the other treatment groups, including G7 PAMAM dendrimer (G7‐100‐Ac), pPD‐L1, and aPD‐L1. d) Change in immune cell populations after seven administrations of saline (vehicle), G7 PAMAM dendrimer (G7), pPD‐L1, aPD‐L1, or DPC (n = 4 per group). Error bars represent the mean ± SEM.

Similar articles

References

    1. Choudhury H., Gorain B., Pandey M., Khurana R. K., Kesharwani P., Int. J. Pharm. 2019, 565, 509. - PubMed
    1. Wang J., Li B., Qiu L., Qiao X., Yang H., J. Biol. Eng. 2022, 16, 18. - PMC - PubMed
    1. Kim D., Javius‐Jones K., Mamidi N., Hong S., Nanoscale 2024, 16, 10208. - PubMed
    1. Smith R. J., Gorman C., Menegatti S., J. Polymer Sci. 2021, 59, 10.
    1. Bakshi A. K., Haider T., Tiwari R., Soni V., Drug Del. Translat. Res. 2022, 12, 2335. - PMC - PubMed