. 2025 Apr 2;26(7):3325.
doi: 10.3390/ijms26073325.

Repeated Administrations of Polyphenolic Extracts Prevent Chronic Reflexive and Non-Reflexive Neuropathic Pain Responses by Modulating Gliosis and CCL2-CCR2/CX3CL1-CX3CR1 Signaling in Spinal Cord-Injured Female Mice

Affiliations

Repeated Administrations of Polyphenolic Extracts Prevent Chronic Reflexive and Non-Reflexive Neuropathic Pain Responses by Modulating Gliosis and CCL2-CCR2/CX3CL1-CX3CR1 Signaling in Spinal Cord-Injured Female Mice

Anna Bagó-Mas et al. Int J Mol Sci. .

Abstract

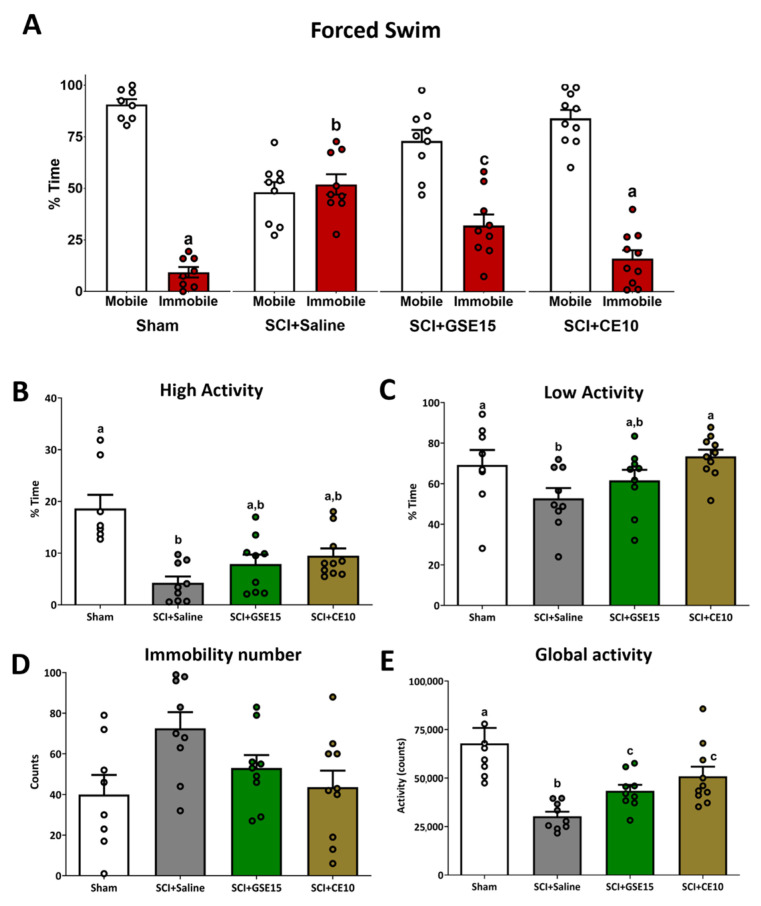
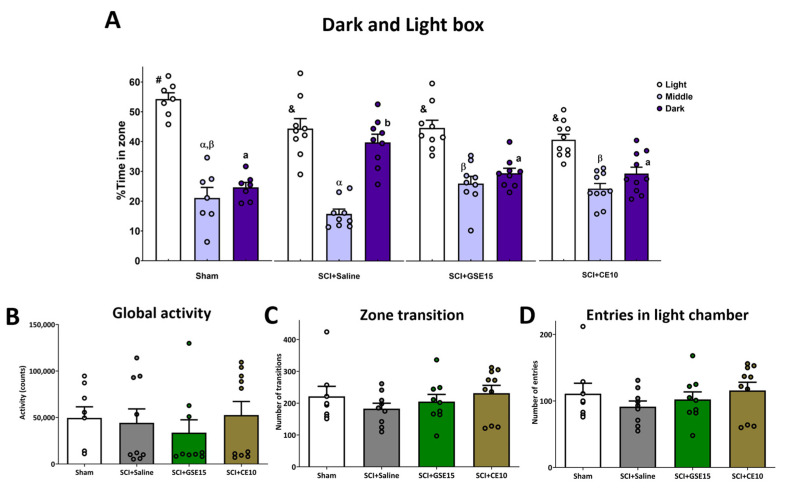
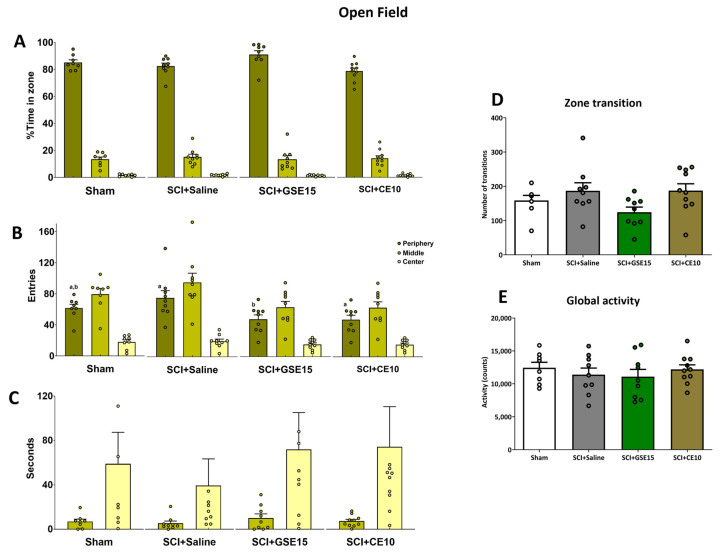
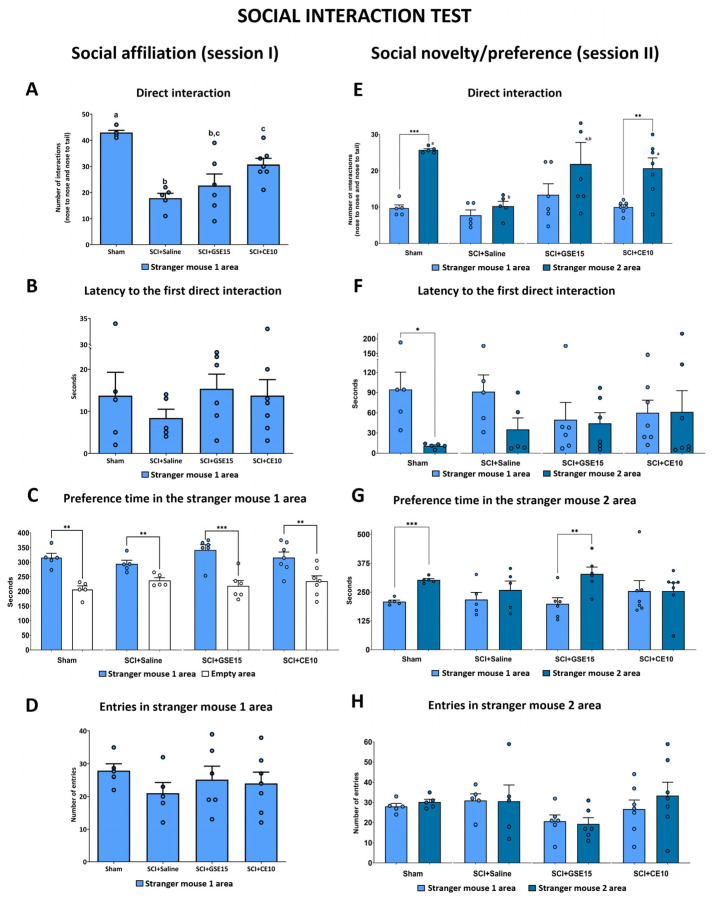
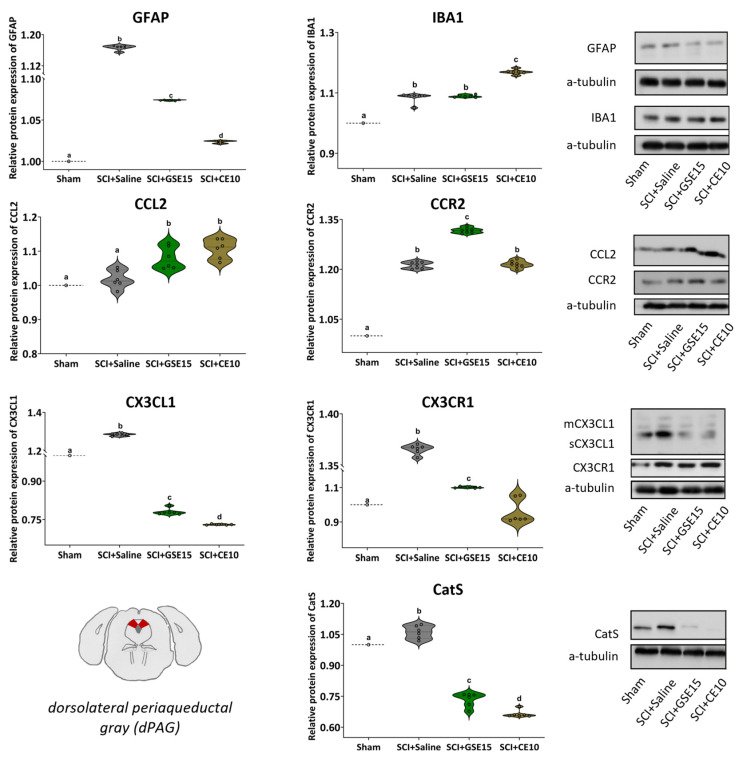
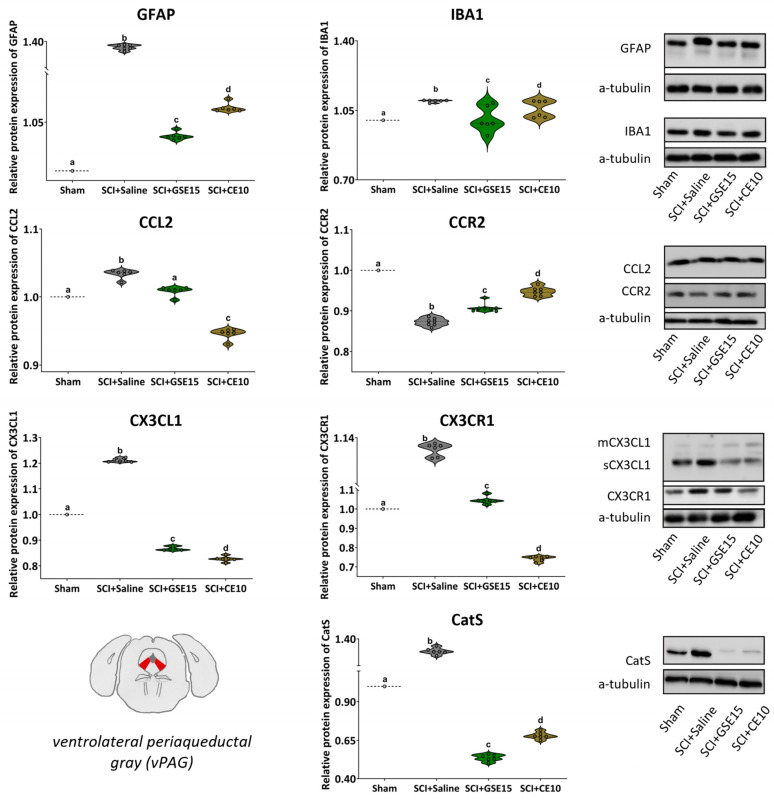
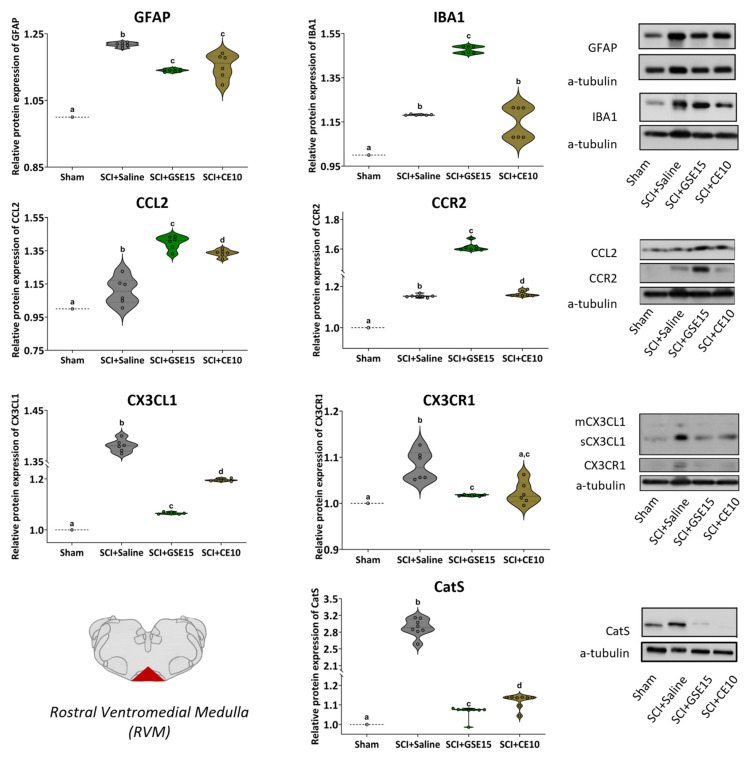
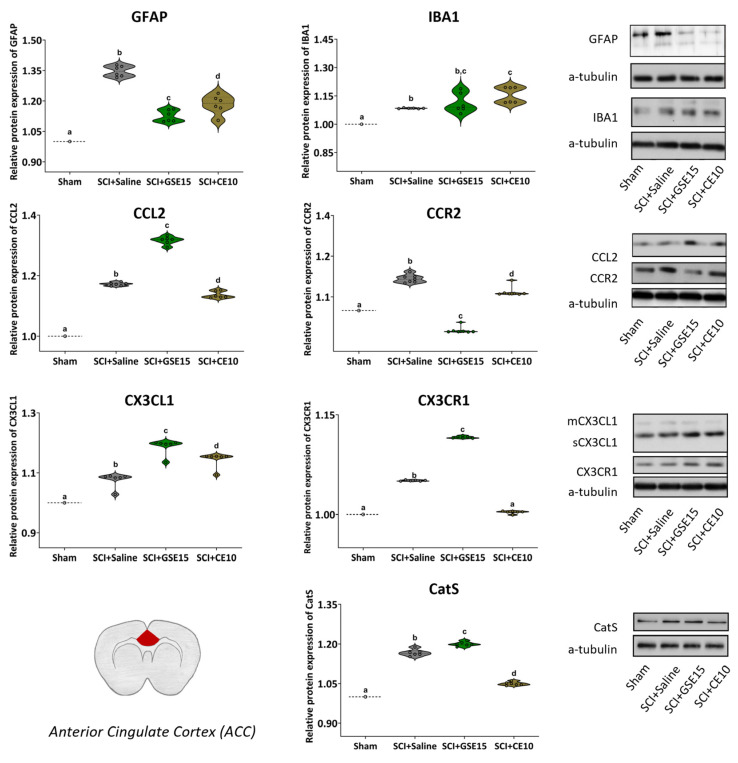
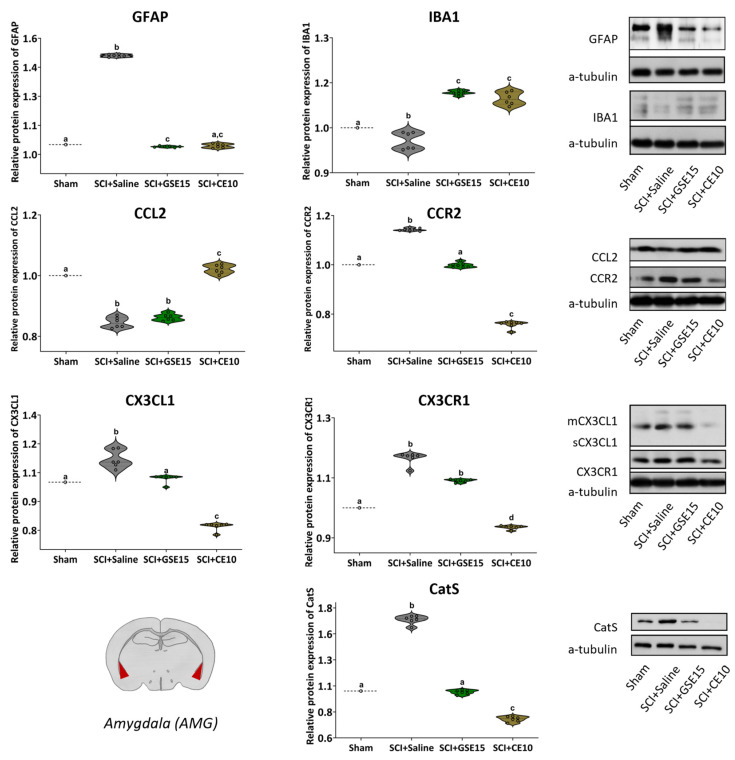
Neuropathic pain after spinal cord injury lacks any effective treatments, often leading to chronic pain. This study tested whether the daily administration of fully characterized polyphenolic extracts from grape stalks and coffee could prevent both reflexive and non-reflexive chronic neuropathic pain in spinal cord-injured mice by modulating the neuroimmune axis. Female CD1 mice underwent mild spinal cord contusion and received intraperitoneal extracts in weeks one, three, and six post-surgery. Reflexive pain responses were assessed weekly for up to 10 weeks, and non-reflexive pain was evaluated at the study's end. Neuroimmune crosstalk was investigated, focusing on glial activation and the expression of CCL2/CCR2 and CX3CL1/CX3CR1 in supraspinal pain-related areas, including the periaqueductal gray, rostral ventromedial medulla, anterior cingulate cortex, and amygdala. Repeated treatments prevented mechanical allodynia and thermal hyperalgesia, and also modulated non-reflexive pain. Moreover, they reduced supraspinal gliosis and regulated CCL2/CCR2 and CX3CL1/CX3CR1 signaling. Overall, the combination of polyphenols in these extracts may offer a promising pharmacological strategy to prevent chronic reflexive and non-reflexive pain responses by modifying central sensitization markers, not only at the contusion site but also in key supraspinal regions implicated in neuropathic pain. Overall, these data highlight the potential of polyphenolic extracts for spinal cord injury-induced chronic neuropathic pain.

Keywords: chemokines; chronic neuropathic pain; glia; neuroinflammation; polyphenols; spinal cord injury.


Conflict of interest statement

The authors declare no conflicts of interest.

Figures

Figure 1
Figure 1
Time-course assessment of (A) locomotor activity, (B) mechanical allodynia and (C) thermal hyperalgesia during the acute, intermediate and chronic phase of SCI-induced neuropathic pain after GSE15 and CE10 treatments in the first, third and sixth week post-injury. Each point and vertical line represent the mean ± SEM. Treatment administration weeks (basal to 1 wpi, 3 to 4 wpi and 6 to 7 wpi) are highlighted with a thick black line. a–c: groups not sharing a letter are significantly different, p < 0.05, by post hoc test. Experimental groups: sham (n = 8), SCI + saline (n = 9), SCI + GSE15 (n = 9), SCI + CE10 (n = 10).
Figure 2
Figure 2
Forced swim test at the chronic phase of SCI-induced neuropathic pain after GSE15 and CE10 treatments in the first, third and sixth week post-injury. Histograms represent (A) the percentage of total time spent in mobility and immobility, (B) the percentage of high activity, (C) the percentage of low activity, as well as the total counts of (D) immobility and (E) global activity. Results are represented as mean ± SEM. a–c: groups not sharing a letter are significantly different, p < 0.05, by post hoc test. Experimental groups: sham (n = 8), SCI + saline (n = 9), SCI + GSE15 (n = 9), SCI + CE10 (n = 10).
Figure 3
Figure 3
Light and dark box test at the chronic phase of SCI-induced neuropathic pain after GSE15 and CE10 treatments in the first, third and sixth week post-injury. Histograms represent (A) the percentage of total time spent in dark and light zones, (B) the counts of global activity, (C) the number of transition between dark and light zones, and (D) the number of entries in the light zone. Results are represented as mean ± SEM. #-&/α-β/a-b: groups not sharing a symbol/letter are significantly different, p < 0.05, by post hoc test. Experimental groups: sham (n = 8), SCI + saline (n = 9), SCI + GSE15 (n = 9), SCI + CE10 (n = 10).
Figure 4
Figure 4
Open field test at the chronic phase of SCI-induced neuropathic pain after GSE15 and CE10 treatments in the first, third and sixth week post-injury. Histograms represent (A) the percentage of total time spent in the periphery, middle, and center zones, (B) the number of entries into these zones, (C) the time spent in these zones, (D) the number of transitions between zones, and (E) the global counts during activity. Results are represented as mean ± SEM, a–b: groups not sharing a letter are significantly different, p < 0.05, by post hoc test. Experimental groups: sham (n = 8), SCI + saline (n = 9), SCI + GSE15 (n = 9), SCI + CE10 (n = 10).
Figure 5
Figure 5
Social interaction test at the chronic phase of SCI-induced neuropathic pain after GSE15 and CE10 treatments in the first, third and sixth week post-injury. Histograms represent the number of direct interactions, the latency to the first interaction, the total time in the stranger mouse area, and the number of entries into the stranger mouse area during (AD) session 1 and (EH) session two. Results are represented as mean ± SEM, a–c: groups not sharing a letter are significantly different, p < 0.05, by post hoc test. Intra-groups significant differences: *** p < 0.001, ** p < 0.01, * p < 0.05. Experimental groups: sham (n = 5), SCI + saline (n = 5), SCI + GSE15 (n = 6), SCI + CE10 (n = 7).
Figure 6
Figure 6
Expression of GFAP, IBA1, CCL2, CCR2, CX3CL1, CX3CR1 and CatS in dPAG at the chronic phase of SCI-induced neuropathic pain after GSE15 and CE10 treatments in the first, third and sixth week post-injury. Protein expression was normalized to a-tubulin. Data are expressed as a relative percentage with respect to sham group (mean ± SEM). a–d: Groups not sharing a letter showed significant differences, p < 0.05. Experimental groups: sham (GFAP n = 6; IBA1 n = 6; CCL2 n = 6; CCR2 n = 7; CX3CL1 n = 6; CX3CR1 n = 6; CatS n = 6), SCI + saline (GFAP n = 6; IBA1 n = 6; CCL2 n = 6; CCR2 n = 7; CX3CL1 n = 6; CX3CR1 n = 6; CatS n = 6), SCI + GSE15 (GFAP n = 6; IBA1 n = 6; CCL2 n = 6; CCR2 n = 7; CX3CL1 n = 6; CX3CR1 n = 6; CatS n = 6), SCI + CE10 (GFAP n = 6; IBA1 n = 6; CCL2 n = 6; CCR2 n = 7; CX3CL1 n = 6; CX3CR1 n = 6; CatS n = 6). Figure S1 of Supporting Information file shows full-length blot images corresponding to the cropped Western blot presented in the figure.
Figure 7
Figure 7
Expression of GFAP, IBA1, CCL2, CCR2, CX3CL1, CX3CR1 and CatS in vPAG at the chronic phase of SCI-induced neuropathic pain after GSE15 and CE10 treatments in the first, third and sixth week post-injury. Protein expression was normalized to a-tubulin. Data are expressed as a relative percentage with respect to sham group (mean ± SEM). a–d: Groups not sharing a letter showed significant differences, p < 0.05. Experimental groups: sham (GFAP n = 6; IBA1 n = 6; CCL2 n = 6; CCR2 n = 7; CX3CL1 n = 6; CX3CR1 n = 6; CatS n = 6), SCI + saline (GFAP n = 6; IBA1 n = 6; CCL2 n = 6; CCR2 n = 7; CX3CL1 n = 6; CX3CR1 n = 6; CatS n = 6), SCI + GSE15 (GFAP n = 6; IBA1 n = 6; CCL2 n = 6; CCR2 n = 7; CX3CL1 n = 6; CX3CR1 n = 6; CatS n = 6), SCI + CE10 (GFAP n = 6; IBA1 n = 6; CCL2 n = 6; CCR2 n = 7; CX3CL1 n = 6; CX3CR1 n = 6; CatS n = 6). Figure S1 of Supporting Information file shows full-length blot images corresponding to the cropped Western blot presented in the figure.
Figure 8
Figure 8
Expression of GFAP, IBA1, CCL2, CCR2, CX3CL1, CX3CR1 and CatS in RVM at the chronic phase of SCI-induced neuropathic pain after GSE15 and CE10 treatments in the first, third and sixth week post-injury. Protein expression was normalized to a-tubulin. Data are expressed as a relative percentage with respect to sham group (mean ± SEM). a–d: Groups not sharing a letter showed significant differences, p < 0.05. Experimental groups: sham (GFAP n = 6; IBA1 n = 6; CCL2 n = 6; CCR2 n = 7; CX3CL1 n = 6; CX3CR1 n = 6; CatS n = 6), SCI + saline (GFAP n = 6; IBA1 n = 6; CCL2 n = 6; CCR2 n = 7; CX3CL1 n = 6; CX3CR1 n = 6; CatS n = 6), SCI + GSE15 (GFAP n = 6; IBA1 n = 6; CCL2 n = 6; CCR2 n = 7; CX3CL1 n = 6; CX3CR1 n = 6; CatS n = 6), SCI + CE10 (GFAP n = 6; IBA1 n = 6; CCL2 n = 6; CCR2 n = 7; CX3CL1 n = 6; CX3CR1 n = 6; CatS n = 6). Figure S2 of Supporting Information file shows full-length blot images corresponding to the cropped Western blot presented in the figure.
Figure 9
Figure 9
Expression of GFAP, IBA1, CCL2, CCR2, CX3CL1, CX3CR1 and CatS in ACC at the chronic phase of SCI-induced neuropathic pain after GSE15 and CE10 treatments in the first, third and sixth week post-injury. Protein expression was normalized to a-tubulin. Data are expressed as a relative percentage with respect to sham group (mean ± SEM). a–d: Groups not sharing a letter showed significant differences, p < 0.05. Experimental groups: sham (GFAP n = 6; IBA1 n = 6; CCL2 n = 6; CCR2 n = 7; CX3CL1 n = 6; CX3CR1 n = 6; CatS n = 6), SCI + saline (GFAP n = 6; IBA1 n = 6; CCL2 n = 6; CCR2 n = 7; CX3CL1 n = 6; CX3CR1 n = 6; CatS n = 6), SCI + GSE15 (GFAP n = 6; IBA1 n = 6; CCL2 n = 6; CCR2 n = 7; CX3CL1 n = 6; CX3CR1 n = 6; CatS n = 6), SCI + CE10 (GFAP n = 6; IBA1 n = 6; CCL2 n = 6; CCR2 n = 7; CX3CL1 n = 6; CX3CR1 n = 6; CatS n = 6). Figure S3 of Supporting Information file shows full-length blot images corresponding to the cropped Western blot presented in the figure.
Figure 10
Figure 10
Expression of GFAP, IBA1, CCL2, CCR2, CX3CL1, CX3CR1 and CatS in AMG at the chronic phase of SCI-induced neuropathic pain after GSE15 and CE10 treatments in the first, third and sixth week post-injury. Protein expression was normalized to a-tubulin. Data are expressed as a relative percentage with respect to sham group (mean ± SEM). a–d: Groups not sharing a letter showed significant differences, p < 0.05. Experimental groups: sham (GFAP n = 6; IBA1 n = 6; CCL2 n = 6; CCR2 n = 7; CX3CL1 n = 6; CX3CR1 n = 6; CatS n = 6), SCI + saline (GFAP n = 6; IBA1 n = 6; CCL2 n = 6; CCR2 n = 7; CX3CL1 n = 6; CX3CR1 n = 6; CatS n = 6), SCI + GSE15 (GFAP n = 6; IBA1 n = 6; CCL2 n = 6; CCR2 n = 7; CX3CL1 n = 6; CX3CR1 n = 6; CatS n = 6), SCI + CE10 (GFAP n = 6; IBA1 n = 6; CCL2 n = 6; CCR2 n = 7; CX3CL1 n = 6; CX3CR1 n = 6; CatS n = 6). Figure S4 of Supporting Information file shows full-length blot images corresponding to the cropped Western blot presented in the figure.
Figure 11
Figure 11
No systemic toxicity indicators after treatment. (A) Time-course assessment of mouse weights during the acute, intermediate and chronic phase of SCI-induced neuropathic pain after GSE15 and CE10 treatments in the first, third and sixth week post-injury. Each point and vertical line represents the mean ± SEM. Treatment administration weeks (basal to 1 wpi, 3 to 4 wpi and 6 to 7 wpi) are highlighted with a thick black line. Experimental groups: sham (n = 8), SCI + saline (n = 9), SCI + GSE15 (n = 9), SCI + CE10 (n = 10); Biomarker quantification of (B,C) hepatotoxicity and (D) nephrotoxicity in the serum of each experimental group at the end of experimental period. The results are represented as the mean ± SEM. Experimental groups: sham (ALT/GTP n = 7; AST/GOT n = 8; UREA n = 8), SCI + saline (ALT/GTP n = 8; AST/GOT n = 6; UREA n = 8), SCI + GSE15 (ALT/GTP n = 8; AST/GOT n = 8; UREA n = 8), SCI + CE10 (ALT/GTP n = 7; AST/GOT n = 8; UREA n = 10).

Similar articles

References

    1. Alizadeh A., Dyck S.M., Karimi-Abdolrezaee S. Traumatic Spinal Cord Injury: An Overview of Pathophysiology, Models and Acute Injury Mechanisms. Front. Neurol. 2019;10:441408. doi: 10.3389/fneur.2019.00282. - DOI - PMC - PubMed
    1. Ahuja C.S., Wilson J.R., Nori S., Kotter M.R.N., Druschel C., Curt A., Fehlings M.G. Traumatic Spinal Cord Injury. Nat. Rev. Dis. Primers. 2017;3:17018. doi: 10.1038/nrdp.2017.18. - DOI - PubMed
    1. Burke D., Fullen B.M., Stokes D., Lennon O. Neuropathic Pain Prevalence Following Spinal Cord Injury: A Systematic Review and Meta-Analysis. Eur. J. Pain. 2017;21:29–44. doi: 10.1002/ejp.905. - DOI - PubMed
    1. Warner F.M., Cragg J.J., Jutzeler C.R., Finnerup N.B., Werhagen L., Weidner N., Maier D., Kalke Y.B., Curt A., Kramer J.L.K. Progression of Neuropathic Pain after Acute Spinal Cord Injury: A Meta-Analysis and Framework for Clinical Trials. J. Neurotrauma. 2018;36:1461–1468. doi: 10.1089/NEU.2018.5960. - DOI - PubMed
    1. Hunt C., Moman R., Peterson A., Wilson R., Covington S., Mustafa R., Murad M.H., Hooten W.M. Prevalence of Chronic Pain after Spinal Cord Injury: A Systematic Review and Meta-Analysis. Reg. Anesth. Pain Med. 2021;46:328–336. doi: 10.1136/RAPM-2020-101960. - DOI - PubMed

MeSH terms