. 2025 Apr 6;26(7):3427.
doi: 10.3390/ijms26073427.

The Ancestral KEAP1-NRF Pathway in Amphioxus Branchiostoma japonicum: Implications for the Evolution of Antioxidant Defense System

Affiliations

The Ancestral KEAP1-NRF Pathway in Amphioxus Branchiostoma japonicum: Implications for the Evolution of Antioxidant Defense System

Weichen Li et al. Int J Mol Sci. .

Abstract

The Kelch-like ECH-associated protein 1 (KEAP1)/Nuclear factor E2-related factor 2 (NRF2) pathway is a key mechanism that responds to oxidative stress and xenobiotic stimuli in vertebrates. However, knowledge of its evolutionary origins remains limited. In this study, we identify the ancestral homologues of KEAP1 and NRF (BjKEAP1 and BjNRF) in cephalochordate amphioxus (Branchiostoma japonicum). BjNRF uniquely combines the feature domains of vertebrates NRF1 and NRF2, marking it as an evolutionary intermediate. High expression levels of Bjkeap1 and Bjnrf in the gill, hepatic cecum, and intestine highlight their roles in environmental defense at key interface tissues. Functional studies reveal that BjKEAP1 regulates the cytoplasmic localization of BjNRF. Typical NRF2 activator sulforaphane (SFN) induces its nuclear translocation and significantly elevates the transcriptional expression of BjNRF and phase II detoxification enzymes. Moreover, exposure to the environmental toxin Benzo[a]pyrene (BaP) activates this stress response system. These findings bridge critical gaps in our understanding of this pathway in basal chordates and offer new insights into the evolutionary trajectory of the KEAP1-NRF system. Furthermore, this study highlights crucial implications for the conservation of amphioxus in deteriorating marine environments.

Keywords: KEAP1; NRF1; NRF2; amphioxus; oxidative stress.


Conflict of interest statement

The authors declare no conflict of interest.

Figures

Figure 1
Figure 1
The sequence and secondary structure of B. japonicum NRF (BjNRF). (A) The nucleotide and deduced amino acid sequences of BjNRF. The BRLZ (basic region leucine zipper) domain was labeled and indicated in blue boxes. (B) The prediction of secondary structure of BjNRF using SMART (https://smart.embl.de/, accessed on 23 September 2023).
Figure 2
Figure 2
Phylogenetic tree of NRF homologues. The phylogenetic tree was constructed by MEGA 7.0 using the amino acid-based Maximum Likelihood (ML) algorithm. The reliability of each node was estimated by bootstrapping with 1000 replications. Amphioxus NRF are indicated in red diamonds. The accession numbers for sequences used are listed in Table S2 of Supplementary Materials.
Figure 3
Figure 3
Domain structure analysis of the BjNRF and NRF homologues of various species. (A) BjNRF is composed of Neh1-7 domains and NHB1/2 domains. (BH) Sequence alignment of NRF2 Neh1-7 domains among human (H. sapiens), mouse (M. musculus), chicken (G. gallus), frog (X. tropicalis), zebrafish (D. rerio), amphioxus (B. floridae, B. belcheri, and B. japonicum), ascidian (C. intestinalis), sea urchin (S. purpuratus), scallop (M. yessoensis), clam (R. philippinarum), and fruit fly (D. melanogaster). (I,J) Sequence alignment of NRF1 NHB1/2 domains among amphioxus and model species. Critical motifs are indicated in red boxes. The lysine residues between DLG and ETGE motif of BjNRF are shaded in pink and those of other species are shaded in yellow. Basic amino acid residues in the FxD/ExxxLLxE/D motif and the QxWxELxSxPELQ motif are shown in the yellow background. Accession numbers for sequences used are listed in Table S2 of Supplementary Materials.
Figure 4
Figure 4
The sequence and structure of B. japonicum KEAP1 (BjKEAP1). (A) The nucleotide and deduced amino acid sequences of BjKEAP1. The conserved BTB (Broad-Complex, Tramtrack, and Bric-a-brac), BACK (BTB and C-terminal Kelch) domains, and six Kelch motifs are labeled and indicated in blue boxes. (B) The prediction of secondary structure of BjKEAP1 using SMART (https://smart.embl.de/, accessed on 23 September 2023).
Figure 5
Figure 5
Phylogenetic tree of KEAP1 homologues. The phylogenetic tree was constructed by MEGA 7.0 using the amino acid-based Maximum Likelihood (ML) algorithm. The reliability of each node was estimated by bootstrapping with 1000 replications. Amphioxus KEAP1 are indicated in red diamonds. The accession numbers for the sequences used are listed in Table S3 of Supplementary Materials.
Figure 6
Figure 6
Domain structure analysis of BjKEAP1 and KEAP1 homologues of various species. (A) BjKEAP1 is divided into five domains according to its function and conservation, namely NTR (N-terminal region), BTB (broad complex, the tram-track and bric-a-brac), IVR (intervening region), DGR (dihydroxyacetone repeat), and CTR (C-terminal region). (B) Amino acid sequence alignment of the BTB domain. The conserved Ser-104 site is shown in a red box. The cysteine residue Cys-151, an amino acid conserved in vertebrates, is shaded in green. (C) Amino acid sequence alignment of IVR domain. The conserved cysteine residues Cys-273 and Cys-288 are shown with a green background. The nuclear output signal (LxxLxxxLxL; L is the hydrophobic residue and x is the other amino acid) is indicated in a red box, and within it, hydrophobic residues are shown in yellow. (D) Amino acid sequence alignment of the DGR domain. The six conserved Kelch motifs are shown in all species investigated and marked by red lines. The accession numbers for the sequences used are listed in Table S3 of Supplementary Materials.
Figure 7
Figure 7
Expression profile of Bjnrf in the various tissues. (A) The relative expressions of Bjnrf were determined in the various tissues, including the muscle, gill, hepatic cecum, ovary, intestine, and notochord, by qRT-PCR. The β-actin was chosen as the internal control for normalization. The expression level in the muscle was set at 1. The results shown are mean values ± S.D. (n = 3). Asterisks indicate a statistical difference compared to the muscle group. The symbol * indicates p < 0.05, ** indicates p < 0.01. (B,D) The relative expression of Bjnrf in the different tissues of B. japonicum detected by in situ hybridization using Bjnrf antisense RNA probes. (C,E) Control. In situ hybridization was performed using Bjnrf sense RNA probes. Gi: gill; Hc: hepatic cecum; Hg: hindgut; Mu: muscle; No: notochord. Ov: ovary. Scale bar: 150 μm.
Figure 8
Figure 8
Expression profile of Bjkeap1 in the various tissues. (A) The relative expression of Bjkeap1 gene was determined in the various tissues, including the muscle, gill, hepatic cecum, ovary, intestine, and notochord, by qRT-PCR. The β-actin gene was chosen as the internal control for normalization. The expression level in the muscle was set at 1. The results shown are mean values ± S.D. (n = 3). Asterisks indicate a statistical difference compared to the muscle group. The symbol ** indicates p < 0.01. (B) Relative expression of the Bjkeap1 gene in the different tissues of B. japonicum detected by in situ hybridization using Bjkeap1 antisense RNA probes. (C) Control. In situ hybridization was performed using Bjkeap1 sense RNA probes. Gi: gill; Hc: hepatic cecum; Hg: hindgut; Mu: muscle; No: notochord. Scale bar: 150 μm.
Figure 9
Figure 9
Subcellular localization of B. japonicum NRF and KEAP1. (A) The HEK293 cells were transiently transfected with pcDNA3.1/BjNRF/EGFP or pcDNA3.1/EGFP. (B) The HEK293 cells were transiently transfected with pcDNA3.1/BjKEAP1/mCherry or pcDNA3.1/mCherry. (C) The HEK293 cells were transiently transfected with pcDNA3.1/BjNRF/EGFP and pcDNA3.1/BjKEAP1/mCherry. The cells were imaged by fluorescence microscopy. The nucleus was stained by DAPI. Scale bar: 10 μm.
Figure 10
Figure 10
Nuclear translocation of BjNRF upon exposure to SFN. The HEK293 cells were transiently co-transfected with pcDNA3.1/BjNRF/EGFP and pcDNA3.1/BjKEAP1/mCherry were exposed to 20 μM SFN for 6 h. The cells were imaged by fluorescence microscopy. The nucleus was stained by DAPI. White arrowheads indicate cells in which BjNRF translocated into the nucleus. Scale bar: 10 μm.
Figure 11
Figure 11
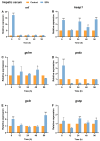
Expression profiles of Bjnrf, Bjkeap1, and phase II detoxification genes in B. japonicum gill after sulforaphane (SFN) treatment. The expression of Bjnrf (A), Bjkeap1 (B), glutamatecysteine ligase modifier subunit (gclm) (C), peroxiredoxin (prdx) (D), glutamate-cysteine ligase catalytic (gclc) (E), and glutathione S-transferase P (gstp) (F) was detected by qRT-PCR at 6 h, 12 h, 24 h, 48 h, and 72 h after 50 μM SFN exposure. The β-actin gene was used as the internal control for normalization. The symbol * indicates p < 0.05, ** indicates p < 0.01, and *** indicates p < 0.001.
Figure 12
Figure 12
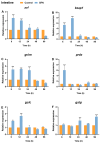
Expression profiles of Bjnrf, Bjkeap1, and phase II detoxification genes in B. japonicum hepatic cecum after sulforaphane (SFN) treatment. The expression of Bjnrf (A), Bjkeap1 (B), glutamatecysteine ligase modifier subunit (gclm) (C), peroxiredoxin (prdx) (D), glutamate-cysteine ligase catalytic (gclc) (E), and glutathione S-transferase P (gstp) (F) was detected by qRT-PCR at 6 h, 12 h, 24 h, 48 h, and 72 h after 50 μM SFN exposure. The β-actin gene was used as the internal control for normalization. The symbol * indicates p < 0.05 and *** indicates p < 0.001.
Figure 13
Figure 13
Expression profiles of Bjnrf, Bjkeap1, and phase II detoxification genes in B. japonicum intestine after sulforaphane (SFN) treatment. The expression of Bjnrf (A), Bjkeap1 (B), glutamatecysteine ligase modifier subunit (gclm) (C), peroxiredoxin (prdx) (D), glutamate-cysteine ligase catalytic (gclc) (E), and glutathione S-transferase P (gstp) (F) was detected by qRT-PCR at 6 h, 12 h, 24 h, 48 h, and 72 h after 50 μM SFN exposure. The β-actin gene was used as the internal control for normalization. The symbol * indicates p < 0.05 and *** indicates p < 0.001.
Figure 14
Figure 14
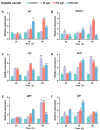
Expression profiles of Bjnrf, Bjkeap1, and antioxidant-related genes in B. japonicum gill exposed to BaP. The expression of Bjnrf (A), Bjkeap1 (B), catalase (cat) (C), superoxide dismutase (sod) (D), glutathione peroxidase (gpx) (E), and glutathione reductase (gsr) (F) was detected by qRT-PCR at 24 h, 48 h, and 96 h after 50 μg/L, 100 μg/L, and 200 μg/L BaP exposure. The β-actin gene was used as the internal control for normalization. The symbol * indicates p < 0.05, ** indicates p < 0.01.
Figure 15
Figure 15
Expression profiles of Bjnrf, Bjkeap1, and antioxidant-related genes in B. japonicum hepatic cecum exposed to BaP. The expression of Bjnrf (A), Bjkeap1 (B), catalase (cat) (C), superoxide dismutase (sod) (D), glutathione peroxidase (gpx) (E), and glutathione reductase (gsr) (F) was detected by qRT-PCR at 24 h, 48 h, and 96 h after 50 μg/L, 100 μg/L, and 200 μg/L BaP exposure. The β-actin gene was used as the internal control for normalization. The symbol * indicates p < 0.05, ** indicates p < 0.01.
Figure 16
Figure 16
Expression profiles of Bjnrf, Bjkeap1, and antioxidant-related genes in B. japonicum intestine exposed to BaP. The expression of Bjnrf (A), Bjkeap1 (B), catalase (cat) (C), superoxide dismutase (sod) (D), glutathione peroxidase (gpx) (E), and glutathione reductase (gsr) (F) was detected by qRT-PCR at 24 h, 48 h, and 96 h after 50 μg/L, 100 μg/L, and 200 μg/L BaP exposure. The β-actin gene was used as the internal control for normalization. The symbol * indicates p < 0.05, ** indicates p < 0.01.

Similar articles

References

    1. Aoki Y., Sato H., Nishimura N., Takahashi S., Itoh K., Yamamoto M. Accelerated DNA adduct formation in the lung of the Nrf2 knockout mouse exposed to diesel exhaust. Toxicol. Appl. Pharm. 2001;173:154–160. doi: 10.1006/taap.2001.9176. - DOI - PubMed
    1. Fuse Y., Kobayashi M. Conservation of the Keap1-Nrf2 System: An Evolutionary Journey through Stressful Space and Time. Molecules. 2017;22:436. doi: 10.3390/molecules22030436. - DOI - PMC - PubMed
    1. Higgins L.G., Kelleher M.O., Eggleston I.M., Itoh K., Yamamoto M., Hayes J.D. Transcription factor Nrf2 mediates an adaptive response to sulforaphane that protects fibroblasts in vitro against the cytotoxic effects of electrophiles, peroxides and redox-cycling agents. Toxicol. Appl. Pharm. 2009;237:267–280. doi: 10.1016/j.taap.2009.03.005. - DOI - PubMed
    1. Moi P., Chan K., Asunis I., Cao A., Kan Y.W. Isolation of NF-E2-related factor 2 (Nrf2), a NF-E2-like basic leucine zipper transcriptional activator that binds to the tandem NF-E2/AP1 repeat of the beta-globin locus control region. Proc. Natl. Acad. Sci. USA. 1994;91:9926–9930. doi: 10.1073/pnas.91.21.9926. - DOI - PMC - PubMed
    1. Gong P., Cederbaum A.I. Transcription factor Nrf2 protects HepG2 cells against CYP2E1 plus arachidonic acid-dependent toxicity. J. Biol. Chem. 2006;281:14573–14579. doi: 10.1074/jbc.M600613200. - DOI - PubMed

Substances