

Uncovering the anti-cancer mechanism of cucurbitacin D against colorectal cancer through network pharmacology and molecular docking
- PMID: 40244518
- PMCID: PMC12006582
- DOI: 10.1007/s12672-025-02056-7
Uncovering the anti-cancer mechanism of cucurbitacin D against colorectal cancer through network pharmacology and molecular docking
Abstract
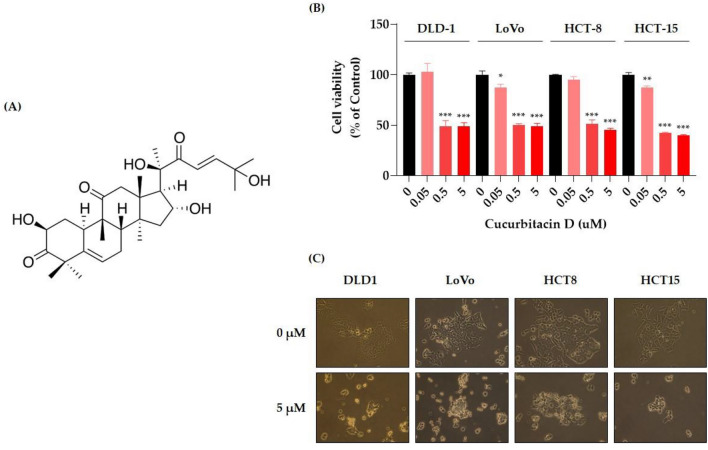
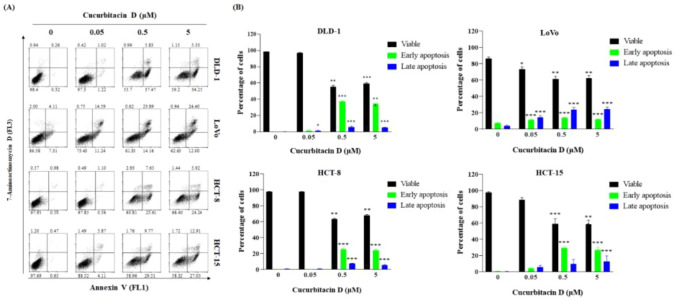
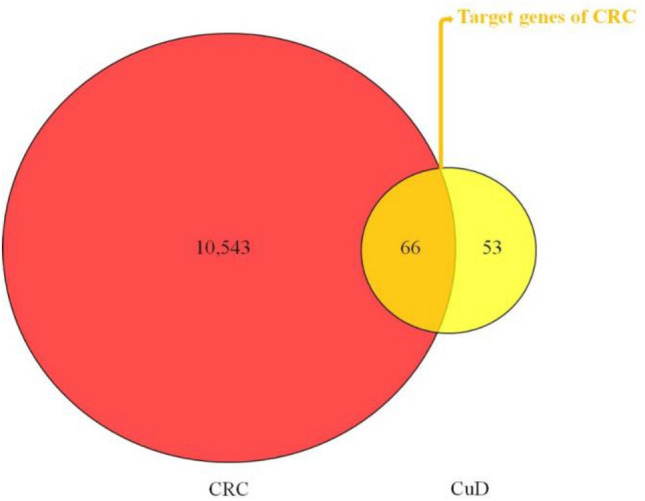
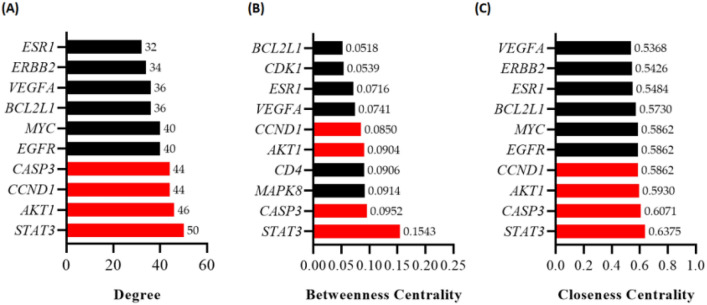
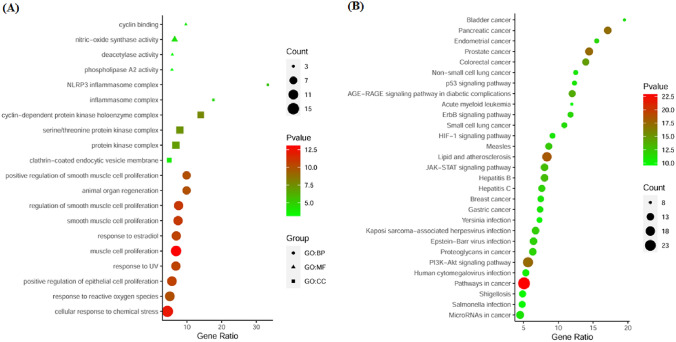
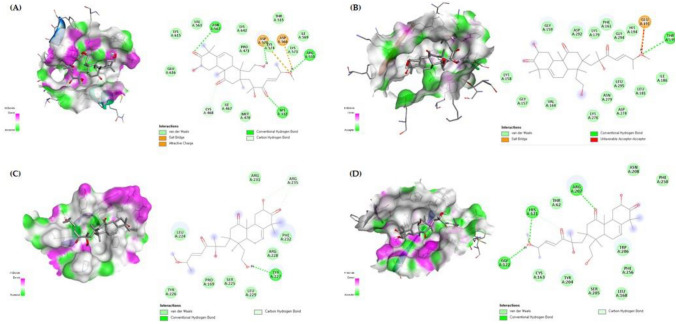
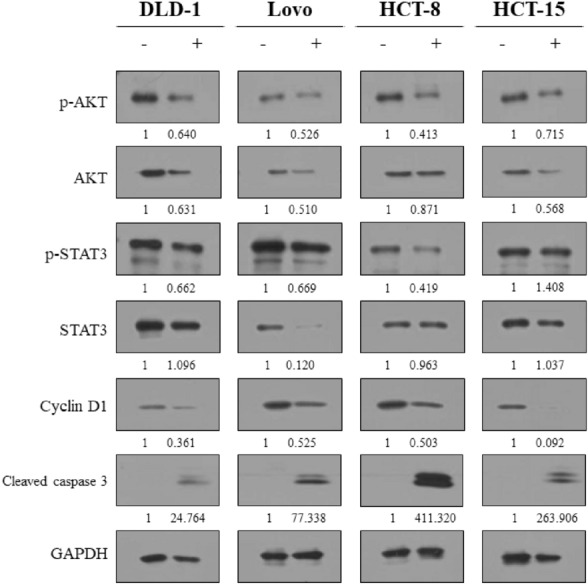
Colorectal cancer is a significant global health challenge due to chemoresistance, necessitating new treatments. Cucurbitacin D, with its anti-cancer properties, shows promise, but its effects on colorectal cancer are not well understood. We investigated the impact of cucurbitacin D on colorectal cancer cell lines using MTT assays and Annexin V/7-AAD staining followed by flow cytometry for apoptosis analysis. Public databases helped identify cucurbitacin D and colorectal cancer-related gene targets for network pharmacology analysis. Protein-protein interaction networks were constructed using STRING and analyzed in Cytoscape. Gene ontology and KEGG pathway enrichment analyses were performed using ClueGo. Molecular docking studies were conducted via Autodock Vina and visualized in Discovery Studio. Western blot assessed protein expression changes in key targets under cucurbitacin D. Cucurbitacin D dose-dependently reduced colorectal cancer cell viability and induced apoptosis. Network pharmacology pinpointed crucial targets like STAT3, AKT1, CCND1, and CASP3. Molecular docking confirmed strong interactions with these targets. Enrichment analysis highlighted involvement in the 'PI3K-AKT,' 'JAK-STAT,' and 'ErbB' signaling pathways. These findings suggest cucurbitacin D as a potential anti-colorectal cancer agent, demonstrating significant effects on cell viability and apoptosis, and engaging critical cancer-related pathways, making it a promising candidate for further colorectal cancer therapeutic research.
Keywords: Colorectal cancer; Cucurbitacin D; Gene ontology; KEGG; Molecular docking; Network pharmacology.
© 2025. The Author(s).
Conflict of interest statement
Declarations. Ethics approval and consent to participate: This article does not contain any studies with human or animals. Competing interests: The authors declare no competing interests.
Figures
Similar articles
-
Mechanism of Bazhen decoction in the treatment of colorectal cancer based on network pharmacology, molecular docking, and experimental validation.Front Immunol. 2023 Sep 20;14:1235575. doi: 10.3389/fimmu.2023.1235575. eCollection 2023. Front Immunol. 2023. PMID: 37799727 Free PMC article.
-
Understanding apoptotic induction by Sargentodoxa cuneata-Patrinia villosa herb pair via PI3K/AKT/mTOR signalling in colorectal cancer cells using network pharmacology and cellular studies.J Ethnopharmacol. 2024 Jan 30;319(Pt 3):117342. doi: 10.1016/j.jep.2023.117342. Epub 2023 Oct 23. J Ethnopharmacol. 2024. PMID: 37879505
-
A network pharmacology approach and experimental validation to investigate the anticancer mechanism and potential active targets of ethanol extract of Wei-Tong-Xin against colorectal cancer through induction of apoptosis via PI3K/AKT signaling pathway.J Ethnopharmacol. 2023 Mar 1;303:115933. doi: 10.1016/j.jep.2022.115933. Epub 2022 Nov 18. J Ethnopharmacol. 2023. PMID: 36403742
-
Exploring the antitumor potential of cucurbitacin B in hepatocellular carcinoma through network pharmacology, molecular docking, and molecular dynamics simulations.Naunyn Schmiedebergs Arch Pharmacol. 2025 May 21. doi: 10.1007/s00210-025-04273-x. Online ahead of print. Naunyn Schmiedebergs Arch Pharmacol. 2025. PMID: 40397117 Review.
-
Exploring the mechanism of action of Yiyi Fuzi Baijiang powder in colorectal cancer based on network pharmacology and molecular docking studies.Biotechnol Genet Eng Rev. 2023 Oct;39(2):1107-1127. doi: 10.1080/02648725.2023.2167765. Epub 2023 Feb 3. Biotechnol Genet Eng Rev. 2023. PMID: 36735641 Review.
Cited by
-
Safety Evaluation of SH003 and Docetaxel Combination in Patients With Breast and Lung Cancer: A Multi-Center, Open-Label, Dose Escalation Phase I Clinical Trial.Integr Cancer Ther. 2025 Jan-Dec;24:15347354251363892. doi: 10.1177/15347354251363892. Epub 2025 Aug 9. Integr Cancer Ther. 2025. PMID: 40782124 Free PMC article. Clinical Trial.
-
Decoding the JAK-STAT Axis in Colorectal Cancer with AI-HOPE-JAK-STAT: A Conversational Artificial Intelligence Approach to Clinical-Genomic Integration.Cancers (Basel). 2025 Jul 17;17(14):2376. doi: 10.3390/cancers17142376. Cancers (Basel). 2025. PMID: 40723258 Free PMC article.
References
Grants and funding
LinkOut - more resources
Full Text Sources
Research Materials
Miscellaneous