. 2025 Apr 1;66(4):44.
doi: 10.1167/iovs.66.4.44.

Quantitative Changes in the Proteome of Chronically Inflamed Lacrimal Glands From a Sjögren's Disease Animal Model

Affiliations

Quantitative Changes in the Proteome of Chronically Inflamed Lacrimal Glands From a Sjögren's Disease Animal Model

Danny Toribio et al. Invest Ophthalmol Vis Sci. .

Abstract

Purpose: The lacrimal gland (LG) is the major source of aqueous tears, and insufficient LG secretion leads to aqueous-deficient dry eye (ADDE) disease. To provide a foundational description of LG's protein expression patterns, we prepared protein extracts of LGs from a wild-type and an ADDE mouse model and analyzed the proteome by quantitative mass spectrometry.

Methods: LGs were isolated from an ADDE mouse model, male non-obese diabetic (NOD) mice and control wild-type BALB/c mice (n = 6 each). Protein samples were prepared in urea-based lysis buffer and protein concentrations determined by the BCA method. The equivalent of 200 µg protein were tryptically digested and analyzed by nanoflow liquid chromatography tandem mass spectrometry (LC-MS/MS). Proteins were identified and quantified using the PEAKS X bioinformatics suite. Downstream differential protein expression analysis was performed using the MS-DAP R package. Selected significantly differentially expressed and detected proteins were subjected to spatial expression analysis using immunohistochemistry.

Results: Cumulatively, the LC-MS/MS-based proteomics analyses of the murine LG samples identified a total of 31,932 peptide sequences resulting in 2617 protein identifications at a 1% false discovery rate at the peptide and protein level. Principal component analysis (PCA) and hierarchical cluster analysis revealed a separation of NOD and BALB/c samples. Overall, protein diversity was consistently higher in NOD samples. After applying global peptide filter criteria and peptide-to-protein rollup, 1750 remaining proteins were subjected to differential expression analysis using the MSqRob algorithm, which identified 580 proteins with statistically significant expression differences. Data are available via ProteomeXchange with identifier PXD060937. At the cellular level, the up- and downregulation of select proteins were confirmed by immunohistochemistry.

Conclusions: Our data suggest that chronic inflammation leads to significant alterations in the LG proteome. Ongoing studies aim to identify potentially unique, inflammation-induced proteins that could be amenable to pharmacological modulation.


Conflict of interest statement

Disclosure: D. Toribio, None; J. Morokuma, None; D. Pellino, None; M. Hardt, None; D. Zoukhri, None

Figures

Figure 1.
Figure 1.
Schematic overview of the study workflow. Lacrimal glands (LGs) were isolated from a Sjögren's disease mouse model, 38-week-old male NOR/LtJ, an insulitis resistant and diabetes-free strain derived from non-obese diabetic (NOD) mice, and isolated from their respective sex- and age-matched wild type control, BALB/c mice (n = 6 each). Protein samples were prepared in 8M urea-based lysis buffer and protein concentrations determined by the BCA method. The equivalent of 200 µg protein were tryptically digested and analyzed by nanoflow liquid chromatography tandem mass spectrometry (LC-MS/MS). Proteins were identified and quantified using the PEAKS X bioinformatics suite. Downstream differential protein expression analysis was performed using the MS-DAP R software package. Selected significantly differentially expressed/detected proteins were subjected to spatial expression analysis using immunohistochemistry. Figure created with BioRender.com.
Figure 2.
Figure 2.
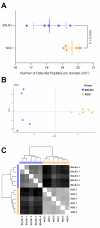
Identification of peptides and proteins using LC-MS/MS. Raw mass spectrometry data were processed using the PEAKS Studio XPro 10.6 software and searches were performed against the M. musculus UniProt and the Mouse Oral Microbiome (MOMD) databases, as described in the Materials and Methods section. (A) Data plot showing the number of identified peptides per sample for each group (18,200 ± 1000 detected peptides in BALB/c samples compared with 19,620 ± 500 in NOD samples, 2-tailed unpaired t-test). (B) Principal component analysis (PCA) plot showing clear separation of LG samples from each group (blue dots depict BALB/c samples whereas orange dots indicate NOD samples). (C) Hierarchical cluster analysis depicting a consistent group-specific clustering of BALB/c and NOD samples.
Figure 3.
Figure 3.
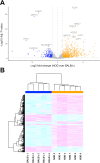
Differentially expressed and detected proteins. After global peptide filtering and peptide-to-protein-rollup, as described in the Materials and Methods section, the remaining proteins were subjected to differential expression analysis (DEA) using the MSqRob algorithm. (A) Volcano plot of differentially expressed proteins in LGs from diseased NOD mice compared with control BALB/c mice (q-value and bootstrapped fold-change cutoffs were defined to be 0.05 and 0.815, respectively). Some of the top 10 most significantly up- and downregulated proteins are specifically labeled. Proteins are ranked in the volcano plot based on their statistical significance (−log10 adjusted P values; y-axis) and their relative expression ratio between NOD and BALB/c samples (log2 fold-changes; x-axis). A positive log2 fold-change value (orange spots) indicates that protein abundance is higher in NOD samples and a negative fold-change (blue spots) indicates the exact opposite. (B) Heatmap of combined differentially expressed and differentially detected proteins corroborating the group-specific and distinctive protein expression profiles of NOD versus BALB/c clusters.
Figure 4.
Figure 4.
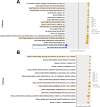
Regulation of Gene Ontology (GO) terms and protein-protein interactions. (A) All quantified differentially expressed and detected proteins were ranked by their effect sizes and −log10 P values prior to being subjected to gene set enrichment analysis (GSEA) against the M5 mouse collection of the Molecular Signature Database, which contains expression signatures of three root GO ontologies: biological processes (prefixed with “GOBP”), cellular components (prefixed with “GOCC”), and molecular functions (prefixed with “GOMF”). The top 20 enriched pathways are shown with upregulated (orange bubbles) and downregulated (blue bubbles) pathways listed on the y-axis while the x-axis represents the normalized enrichment scores. The top 50 upregulated (B) and top 50 downregulated (C) differentially expressed proteins were inputted into the STRING database to evaluate protein-protein interactions or associations. Interaction network maps were generated with a medium confidence (0.400) and the main interacting clusters observed were color highlighted.
Figure 5.
Figure 5.
Regulation of curated canonicals pathways and cell type cluster marker genes. All quantified differentially expressed and detected proteins were ranked by their effect sizes and −log10 P values prior to being subjected to gene set enrichment analysis (GSEA) against the M2 and M8 mouse collections of the Molecular Signature Database. (A) Bubble plot showing the top 20 enriched pathways in our dataset from the M2 collection which contains curated gene sets divided into expression signatures of genetic and chemical perturbations, and canonical pathways. (B) All 15 enriched pathways from the M8 collection which contains cluster marker genes for cell types identified in single-cell sequencing studies of mouse tissue. Enrichments are [NOD]/[BALB/c] and more gene sets were upregulated than downregulated.
Figure 6.
Figure 6.
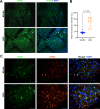
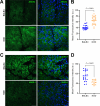
Filamin-A upregulated expression and co-localization with alpha-smooth muscle actin. (A) Representative immunofluorescence photomicrographs of filamin-A (FLNA) staining in BALB/c (top) versus NOD (bottom) LG tissue sections. Arrow heads depict positive FLNA staining present in tissue-infiltrated lymphocytes. Scale bars = 100 µm. Primary antibody was omitted for negative control sections (see Supplementary Fig. S2). (B) FLNA staining was statistically significantly higher in NOD samples when compared with BALB/c samples. Data plot is presented as means ± SD, n = 17 to 19 from 4 different mice for each strain. (C) Representative immunofluorescence photomicrographs of LG tissue sections from control (top) and diseased (bottom) animals double-stained for FLNA and alpha-smooth muscle actin (α-SMA). Arrow heads depict positive FLNA staining present in the tissue-infiltrated lymphocytes. Scale bars = 50 µm. The merged channels (FITC + TRITC) images (right) show strong FLNA co-localization with α-SMA expressed in the myoepithelial cells of the LG.
Figure 7.
Figure 7.
Immunohistochemical confirmation of additional selected differentially expressed proteins. (A) Representative photomicrographs of annexin A2 (ANXA2) staining in BALB/c (top) versus NOD (bottom) LG tissue sections. Scale bars = 50 µm. Primary antibody was omitted for negative control sections (see Supplementary Fig. S2). (B) ANXA2 staining was statistically significantly higher in NOD samples when compared with BALB/c samples; n = 21 to 23 from 3 different mice per group. (C) Representative photomicrographs of valyl-tRNA synthetase (VARS-1) staining in BALB/c (top) versus NOD (bottom) LG tissue sections. Scale bar = 50 µm. (D) VARS-1 staining was statistically significantly lower in NOD samples when compared with BALB/c samples; n = 12 to 20 from 3 different mice per group. Data plots are presented as means ± SD.
Figure 8.
Figure 8.
Immunohistochemical staining of APAF1 interacting protein (APIP). (A) Representative immunofluorescence photomicrographs of APIP staining in BALB/c (top) versus NOD (bottom) LG tissue sections. (B) Representative immunofluorescence photomicrographs of LG tissue sections from control (top) and diseased (bottom) animals double-stained for APIP and Aquaporin-5 (AQP5). All scale bars = 50 µm.

Similar articles

References

    1. Conrady CD, Joos ZP, Patel BC.. Review: the lacrimal gland and its role in dry eye. J Ophthalmol. 2016; 2016: 7542929. - PMC - PubMed
    1. Dartt DA. Neural regulation of lacrimal gland secretory processes: relevance in dry eye diseases. Prog Retin Eye Res. 2009; 28: 155–177. - PMC - PubMed
    1. Hodges RR, Dartt DA.. Regulatory pathways in lacrimal gland epithelium. Int Rev Cytol. 2003; 231: 129–196. - PubMed
    1. Zoukhri D. Effect of inflammation on lacrimal gland function. Exp Eye Res. 2006; 82: 885–898. - PMC - PubMed
    1. Barabino S, Aragona P, di Zazzo A, Rolando M. Updated definition and classification of dry eye disease: renewed proposals using the nominal group and Delphi techniques. Eur J Ophthalmol. 2021; 31: 42–48. - PubMed