. 2025 Apr 17;135(12):e181471.
doi: 10.1172/JCI181471. eCollection 2025 Jun 16.

IL-7-mediated expansion of autologous lymphocytes increases CD8+ VLA-4 expression and accumulation in glioblastoma models

Affiliations

IL-7-mediated expansion of autologous lymphocytes increases CD8+ VLA-4 expression and accumulation in glioblastoma models

Kirit Singh et al. J Clin Invest. .

Abstract

The efficacy of T cell-activating therapies against glioma is limited by an immunosuppressive tumor microenvironment and tumor-induced T cell sequestration. We investigated whether peripherally infused nonantigen specific autologous lymphocytes could accumulate in intracranial tumors. We observed that nonspecific autologous CD8+ ALT cells can indeed accumulate in this context, despite endogenous T cell sequestration in bone marrow. Rates of intratumoral accumulation were markedly increased when expanding lymphocytes with IL-7 compared with IL-2. Pretreatment with IL-7 ALT also enhanced the efficacy of multiple tumor-specific and nontumor-specific T cell-dependent immunotherapies against orthotopic murine and human xenograft gliomas. Mechanistically, we detected increased VLA-4 on mouse and human CD8+ T cells following IL-7 expansion, with increased transcription of genes associated with migratory integrin expression (CD9). We also observed that IL-7 increases S1PR1 transcription in human CD8+ T cells, which we have shown to be protective against tumor-induced T cell sequestration. These observations demonstrate that expansion with IL-7 enhances the capacity of ALT to accumulate within intracranial tumors and that pretreatment with IL-7 ALT can boost the efficacy of subsequent T cell-activating therapies against glioma. Our findings will inform the development of future clinical trials where ALT pretreatment can be combined with T cell-activating therapies.

Keywords: Cell migration/adhesion; Immunotherapy; Neuroscience; Oncology; T cells.


Figures

Figure 1
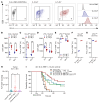
Figure 1. IL-7–ALT CD8+ cells demonstrate increased accumulation within orthotopic glioblastoma models despite endogenous T cell sequestration in bone marrow.
(A) Study overview (n = 4–5 mice/group/time point for all graphs). (B) Percentage of IL-2–ALT and IL-7–ALT CD45.1+ dose detected in tumor by 48-hours after administration (CD4+ & CD8+ T cells). (C) Fold-change relative to Day 0 of exogenous CD45.1+CD4+ T cell entry and (D) CD45.1+CD8+ T cell entry into brain tumors. (E) Fold-change relative to Day 0 of exogenous CD45.1+CD4+ T cell entry and (F) CD45.1+CD8+ T cell entry into bone marrow. (G) Time course of spleen sizes following ALT. Weights from control mice represented by dashed line (0.0823g, n = 5). Dashed line in CF represents baseline (i.e., 1x). Statistical analyses performed via 2-way ANOVA and data presented as mean ± SEM unless otherwise specified. Experimental outline generated using BioRender.com. *P < 0.05, **P ≤ 0.01.
Figure 2
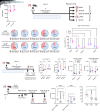
Figure 2. IL-7 ALT synergizes with specific and nonspecific T cell–activating/checkpoint blockade therapies in orthotopic glioma models.
(A) Evaluation of IL-7 and IL-2 ALT combined with hCD3:EGFRvIII BRiTE in NSG mice. Mice (n = 5–6 /group) were implanted with U87vIII and treated with 5 × 10⁶ IV hPBMCs on day 5, with serial IV BRiTE (50 μg) on days 5–9. (B) Cytotoxicity assay using BRiTE cocultured with tumor cells (U87vIII) and hPBMCs expanded with IL-2 or IL-7. Nonlinear fitted dose-response curves shown with SEM (n = 10–12/group, Pearson Correlation Coefficient r = 0.98, ****P < 0.0001). (C and D) Study overview and findings of a screening approach to identify the best combinatorial mAb approach with ALT (n = 5–7/group). (E) Survival of combination α4-1BB & IL-7 ALT therapy compared to monotherapy controls treated using same regimen in (C) (n = 5/group). (F) C57BL/6J mice implanted with 6 × 10⁴ GL261 and treated using same regimen in (C) with αPD-1 (n = 6–12/group, pooled data across 2 experiments). (G) Monitoring of bodyweight throughout the treatment period and for two weeks after for survival experiment in F (n = 6–7/group). Comparison via multiple unpaired t tests and data presented as mean ± SEM. Survival comparisons performed via a log-rank (Mantel-Cox) χ2 test. Experimental outlines generated using BioRender.com. *P < 0.05, **P ≤ 0.01, ***P < 0.001, ****P < 0.0001.
Figure 3
Figure 3. IL-7–expanded CD8+ T cells accumulating in tumor consist of both central and effector memory phenotypes.
(A) Study overview in C57BL/6J mice (n = 4–6/group for all graphs). (B) Weight-adjusted counts of CD45.1+CD8+ T cells 3- and 48-hours following ALT in tumors (multiple unpaired t tests shown). (C) Proportion of IL-7–ALT cells in tumor that are CD4+ or CD8+ T cells (unpaired t test). (D) Proportions of exogenous ALT to endogenous T cells in tumor 48 hours following administration, with paired dot-plot showing individual values across groups. (E) Comparison of Endogenous (CD45.2+) or exogenous/ALT (CD45.1+) (F) CD8+ TN, TCM, TEFF proportions between IL-2 and IL-7 ALT in tumor 48 hours following administration. (G and H) Comparison of IL-2 and IL-7 ALT phenotype fractions in tumor to ALT preadministration. (I and J) Weight normalized counts at both 3- and 48-hour timepoints of CD8+ TCM and CD8+ TEFF accumulation in tumor when treating with IL-2 or IL-7 ALT (multiple unpaired t tests shown). (K) Comparison of CD8+ TCM and CD8+ TEFF presence in tumor following IL-2–ALT or IL-7 ALT. Statistical analyses performed via 2-way ANOVA and data presented as mean ± SEM unless otherwise specified. Experimental outline generated using BioRender.com. *P < 0.05, **P ≤ 0.01, ***P < 0.001, ****P < 0.0001.
Figure 4
Figure 4. Expansion with IL-7 upregulates expression of the promigratory integrin VLA-4 on murine CD8+ T cells, which is required for enhanced intratumoral accumulation.
(A) Representative gating strategy shown for VLA-4 expression on CD8+ T cells from IL-2 or IL-7 ALT. (B and C) CD8+ T cell VLA-4 expression (gMFI) and proportion of CD8+ VLA-4Hi T cells shown when expanding with IL-2 or IL-7 ALT (experiment outline in Figure 3, n = 4–6/group). (D and E) CD8+ T cell LFA-1 expression (gMFI) and proportion of CD8+ LFA-1Hi T cells shown when expanding with IL-2 or IL-7 ALT. (F and G) Analysis of the CD8+ T cell VLA-4Hi or LFA-1Hi proportion in ALT cellular product at expansion end (2 technical replicates). (H) Entry of CD45.1+CD8+ T cells in tumor following VLA-4Lo, VLA-4Hi ALT or VLA-4Hi ALT, and αVLA-4 (single-dose 200 μg intraperitoneal αVLA-4 antibody (BioXCell) pre-ALT, 3 pooled experiments shown, n = 8–20/group, 1-way ANOVA shown). (I) Evaluation of VLA-4 expression on the endogenous CD8+ T cell compartment over time (IL-2 and IL-7 treatment groups pooled, n = 9–12/group). Survival comparisons performed via log-rank (Mantel-Cox) χ2 test. Statistical analyses performed using unpaired t tests and data presented as mean ± SEM unless otherwise specified. *P < 0.05, **P ≤ 0.01, ***P < 0.001.
Figure 5
Figure 5. Lymphocytic VLA-4 & endothelial/pericytic VCAM-1 expression increases over time on native T cells in murine glioma.
(A) Comparison of CD8+ T cell VLA-4 gMFI expression on endogenous cells over time from prior experiment (shown in Figures 3 and 4). (n = 4–6/group). (B) Study overview to assess VLA-4 expression across compartments. (C and D) Evaluation of VLA-4Lo and VLA-4Hi fractions across different compartments. Comparisons in D via 2-way ANOVA (n = 5–6/group). (E) Study overview to assess endothelial VCAM-1 in the CNS. No ALT was used. Tumor hemispheres were collected, and endothelial cells (CD31+CD13)/pericytes (CD31CD13+) were analyzed (n = 5/group). (F and G) Frequency of VCAM-1+ pericytes/endothelial cells in tumor at D12 and D17 following tumor/sham injection. (H and I) Counts of VCAM-1/VCAM-1+ pericytes/endothelial cells in tumor compared to sham controls at D17 following intracranial injections. (J) Study overview to evaluate intraperitoneal/intracranial VLA-4 blockade (n = 5/group). (K) Intracranial CD4+ & CD8+ T cell counts 72 hours following administration of intraperitoneal/intracranial αVLA-4 or sham controls. Comparisons via 1-way ANOVA. (L) In vitro cytotoxicity with CT2AvIII, T cells, αVLA-4, and BRiTE at EC50 concentration of 0.01 μg/mL. n = 12/dose level. Comparisons via 1-way ANOVA. Statistical analyses performed using unpaired t tests and data presented as mean ± SEM unless otherwise specified. Experimental outlines generated using BioRender.com. *P < 0.05, **P ≤ 0.01, ***P < 0.001, ****P < 0.0001.
Figure 6
Figure 6. IL-7 expansion of hPBMCs from both healthy volunteers and patients with glioblastoma upregulates lymphocytic VLA-4 expression.
(A) hPBMC growth rates for IL-2 versus IL-7 coculture from both glioblastoma and control volunteer leukaphereses. (n = 5–6/group). (BD) CD4+:CD8+ T cell ratios and comparisons for IL-2 versus IL-7 for control and glioblastoma samples at expansion end. (C and D) Comparisons in B via 2-way ANOVA and, in C and D, via 1-way ANOVA. (E) Overview of CD8+ T cell phenotype fractions at expansion end: Naive (TN), Effector (TEFF), Effector Memory (TEM), Resident Memory (TRM), Central Memory (TCM), Stem Cell Memory (TSCM). (F) Fraction of CD8+ TSCM at expansion end across groups. (GJ) Gating strategy for VLA-4Hi fraction and proportion of VLA-4Hi in all CD8+ T cells (H) as well as CD8+ TEFF (I) and CD8+ TSCM cells (J) at expansion end. (K) Cytotoxicity assay with tumor (U87vIII) cocultured with IL-2 or IL-7 expanded donor/glioblastoma hPBMCs & BRiTE. (LO) Degranulation assays assessing CD107Hi, IFN-γ+, TNF-α+, GzmB+ in glioblastoma CD8+ T cells expanded with IL-2 and IL-7. Comparisons via multiple unpaired t tests (n = 5–6/group). Statistical analyses performed using 1-way ANOVA and data presented as mean ± SEM unless specified. *P < 0.05, **P ≤ 0.01, ***P < 0.001.
Figure 7
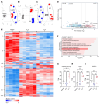
Figure 7. IL-7 upregulates transcription of genes associated with enhanced migratory integrin expression (CD9) and protection against tumor-induced sequestration (S1PR1).
(AC) Principal component analysis of naive (gray), IL-2–expanded (blue), and IL-7–expanded (red) CD8+ T cells (n = 4–5/group for all graphs). (D) Volcano plot comparing differential gene expression between IL-2– and IL-7–expanded CD8+ T cells. (E) Hierarchical cluster heatmaps of the naive, IL-2, and IL-7 groups with seven unique clusters identified (I–VII). (F) Gene Ontology biological process analysis of genes expressed in cluster IV (upregulated with IL-7, EPHA4, CD9, ITGA6, S1PR1, among others). (GI) Comparisons of raw transcripts per million (TPM) across groups for ITGA6, CD9, and S1PR1 (comparisons via 1-way ANOVA). PCA analysis was generated using BioJupies (66). Hierarchical cluster heatmaps were generated using clustergrammer (Ma’ayan lab) (67). Gene Ontology (GO) biological process analysis was performed using the NIH DAVID database (53). Volcano plots were generated using VolcaNoseR (69). Comparisons via 1-way ANOVA and data presented as mean ± SEM unless otherwise specified. *P < 0.05, **P ≤ 0.01.

Similar articles

References

    1. Belmontes B, et al. Immunotherapy combinations overcome resistance to bispecific T cell engager treatment in T cell-cold solid tumors. Sci Transl Med. 2021;13(608):eabd1524. doi: 10.1126/scitranslmed.abd1524. - DOI - PubMed
    1. Woroniecka KI, et al. 4-1BB Agonism averts TIL exhaustion and licenses PD-1 blockade in glioblastoma and other intracranial cancers. Clin Cancer Res. 2020;26(6):1349–1358. doi: 10.1158/1078-0432.CCR-19-1068. - DOI - PMC - PubMed
    1. Baeuerle PA, Wesche H. T-cell-engaging antibodies for the treatment of solid tumors: challenges and opportunities. Curr Opin Oncol. 2022;34(5):552–558. doi: 10.1097/CCO.0000000000000869. - DOI - PMC - PubMed
    1. Tomaszewski WH, et al. Broad immunophenotyping of the murine brain tumor microenvironment. J Immunol Methods. 2021;499:113158. doi: 10.1016/j.jim.2021.113158. - DOI - PMC - PubMed
    1. Chongsathidkiet P, et al. Sequestration of T cells in bone marrow in the setting of glioblastoma and other intracranial tumors. Nat Med. 2018;24(9):1459–1468. doi: 10.1038/s41591-018-0135-2. - DOI - PMC - PubMed

MeSH terms