. 2025 Jul;39(13):e25020.
doi: 10.1002/jcla.25020. Epub 2025 Apr 17.

Exploring the Role of T-Cell Metabolism in Modulating Immunotherapy Efficacy for Non-Small Cell Lung Cancer Based on Clustering

Affiliations

Exploring the Role of T-Cell Metabolism in Modulating Immunotherapy Efficacy for Non-Small Cell Lung Cancer Based on Clustering

Hongzhe Guo et al. J Clin Lab Anal. 2025 Jul.

Abstract

Background: Immunotherapy, especially immune checkpoint blockade (ICB) therapy, has demonstrated noteworthy advancements in the realm of non-small cell lung cancer (NSCLC). However, the efficacy of ICB therapy is limited to a small subset of patients with NSCLC, and the underlying mechanisms remain poorly understood.

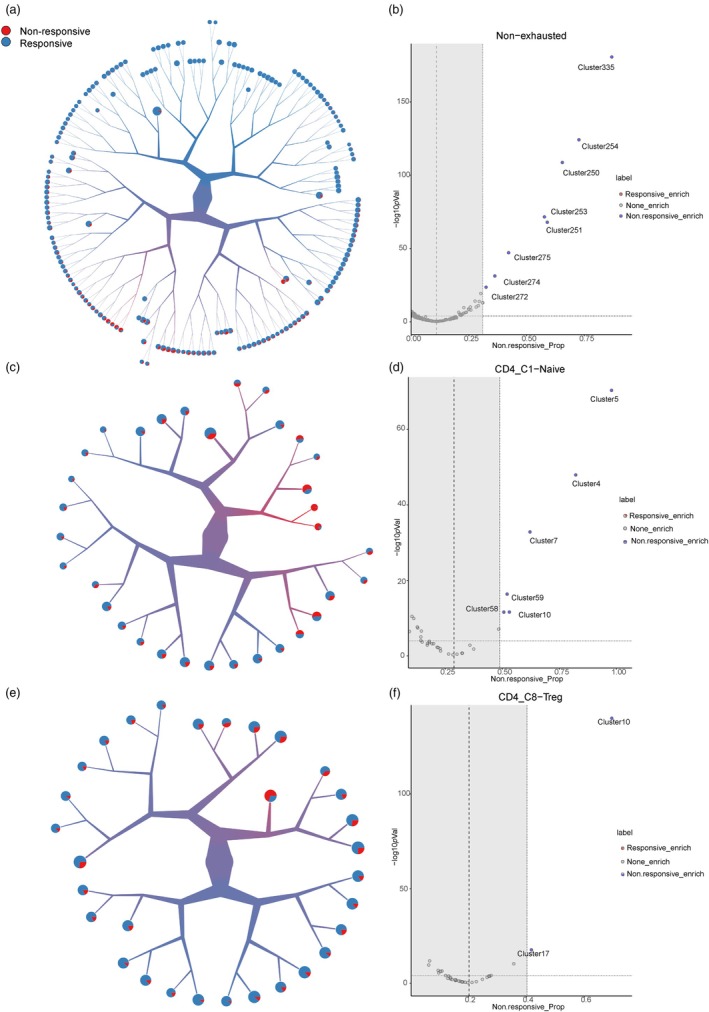
Study design and discoveries: In this study, we conducted a comprehensive investigation of the metabolic profiles of infiltrating T cells in NSCLC tumors and revealed the metabolic heterogeneity, which associated with the prognosis of ICB therapy, in three T-cell subtypes. After metabolic clustering, we split these metabolic clusters into two groups: Nonresponse-associated (NR) clusters that enriched with cells from nonresponders, and response-associated (R) clusters that not belonging to NR clusters. Then, we elucidated their metabolic differences and specific functions. Notably, we discovered HSPA1A was significantly downregulated in NR clusters of all three T-cell subtypes. In addition, leveraging single-cell T-cell receptor sequencing data and pseudotime series analysis, we revealed the reciprocal interconversion between R and NR metabolic clusters within the same T-cell clone. This suggests a potential metabolic reprogramming capability of T cells. Furthermore, through the analysis of intercellular communication, we identified the specific intercellular signaling in the R clusters, which might promote the activation and regulation of signal transduction pathways that affect the prognosis of ICB therapy.

Conclusion: In conclusion, our study offers substantial insights into the mechanisms of relationships between T-cell metabolisms and ICB therapy outcomes, shedding light on the mechanism of immunotherapy efficacy in patients with NSCLC. Such investigations will contribute to overcoming treatment resistance.

Keywords: T cell; clustering; immune metabolism; immunotherapy; non‐small cell lung cancer.


Conflict of interest statement

Rui Hou and Yue Gong are employed by Genies Beijing Co., Ltd. All other authors declare no competing interests.

Figures

FIGURE 1
FIGURE 1
Metabolic clustering results of three T‐cell subtypes. (a) Visualization and clustering of TooManyCells tree structure of Tnex cells. Cells start from the initial root node and are divided according to similarities and differences in metabolic transcription profiles. The colors within the branches indicate the proportion of cells from either responding patients (blue) or nonresponding patients (red). The pie chart at the end of the branch shows the proportion of cells in this terminal cluster that respond to patients versus nonresponding patients. (b) The volcano map represents a deviation in the proportion of unresponsive patient cells between each cluster terminal and the original Tnex. The dashed line parallel to the Y‐axis is the original percentage of nonresponding patient cells in Tnex. A dashed line parallel to the X‐axis indicates a p value = 0.001, a one‐sided z‐test. Points represent each cluster terminal. (c) Same as in (a) but for Tn cells. (d) Same as in (b) but for Tn cells. (e) Same as in (a) but for Treg cells. (f) Same as in (b) but for Treg cells.
FIGURE 2
FIGURE 2
Metabolic heterogeneity of NR and R subgroups. (a) The differential gene volcano map shows the difference in gene expression between the NR and R subpopulations of Tnex cells. In this figure, red dots represent genes that are significantly upregulated in the NR subpopulation, and blue dots represent genes that are significantly downregulated. See Table S1 for details. (b) Clustering results of Tnex cells in SCC dataset based on Leiden algorithm. (c) The violin diagram shows the differential expression distribution of HSPA1A gene in different clusters in (b), and the p value was far less than 0.05. (d) According to the expression of HSPA1A in (c), the two subgroups in (b) were defined as NR (0) and R (1). For naive and Treg subtypes, we also recluster each subtype by Leiden algorithm and define R and NR according to the expression of HSPA1A. The bar chart shows the proportion of cells from responding patients before clustering of the three T‐cell subtypes and the proportion of cells from responding patients in the R subgroup after clustering. B is the proportion of cells before clustering and L is the proportion of cells from responding patients in the R subgroup after clustering (SCC). (e) GO (gene ontology) pathway enrichment analysis of significantly upregulated genes in the NR subpopulation of Tnex cells. The vertical axis is biological processes.
FIGURE 3
FIGURE 3
Metabolic changes of NR and R in the same clone of Tnex. (a) The distribution landscape of different macrostates in the same clonotype contains two subgroups NR and R in several macrostates. Each point represents a cell, and different colors represent different macroscopic states. (b) The probability of transfer between five different macroscopic states. (c) The expression trends of the top 20 genes (except ribosome‐related genes) whose expression values were most correlated with the fate probability of R_3 were sorted according to pseudotime peaks. (d) The expression trends of the top 20 genes (excluding ribosome‐related genes and nonconvergent genes) whose expression values were most correlated with R_3 fate probability in NR were sorted according to pseudotime peaks. (e) Same as in (c) but for R_4. (f) Same as in (c) but for NR.
FIGURE 4
FIGURE 4
Communication between T‐cell subtypes. (a) Heat map of communication between Tnex cell NR subsets and other T‐cell subtypes. The numbers in the matrix are the number of ligand–receptor pairs per cell type, colored relative to the maximum count. Rows represent cells expressing ligands and columns represent cells expressing receptors. (b) Same as in (a) but for R subsets.

Similar articles

References

    1. Oliver A. L., “Lung Cancer: Epidemiology and Screening,” The Surgical Clinics of North America 102, no. 3 (2022): 335–344. - PubMed
    1. Peng L., Huang L., Su Q., Tian G., Chen M., and Han G., “LDA‐VGHB: Identifying Potential lncRNA‐Disease Associations With Singular Value Decomposition, Variational Graph Auto‐Encoder and Heterogeneous Newton Boosting Machine,” Briefings in Bioinformatics 25, no. 1 (2023): bbad466. - PMC - PubMed
    1. Li W., Liu B., Wang W., et al., “Lung Cancer Stage Prediction Using Multi‐Omics Data,” Computational and Mathematical Methods in Medicine 2022 (2022): 2279044. - PMC - PubMed
    1. Bilotta M. T., Antignani A., and Fitzgerald D. J., “Managing the TME to Improve the Efficacy of Cancer Therapy,” Frontiers in Immunology 13 (2022): 954992. - PMC - PubMed
    1. Hynes PR, Das MJ. Stereotactic Radiosurgery (SRS) and Stereotactic Body Radiotherapy (SBRT). 2023. Jul 25. In: StatPearls [Internet]. Treasure Island: (FL): StatPearls Publishing; 2024 Jan–. PMID: 31194323. - PubMed

MeSH terms

Substances