. 2025 May;21(21):e2500813.
doi: 10.1002/smll.202500813. Epub 2025 Apr 17.

Straining Flow Effects on Sperm Flagellar Energetics in Microfluidic Cross-Slot Traps

Affiliations

Straining Flow Effects on Sperm Flagellar Energetics in Microfluidic Cross-Slot Traps

Javane Javaherchian et al. Small. 2025 May.

Abstract

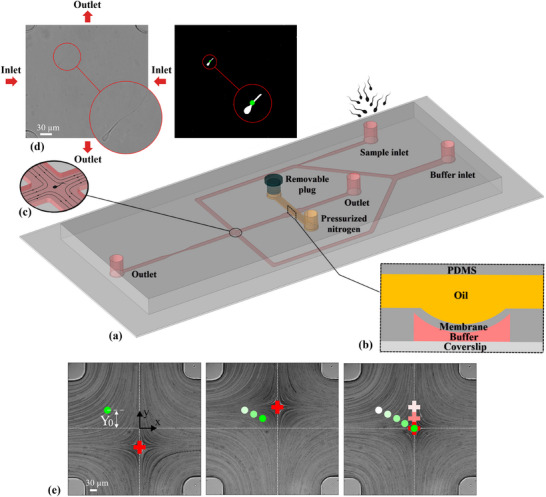
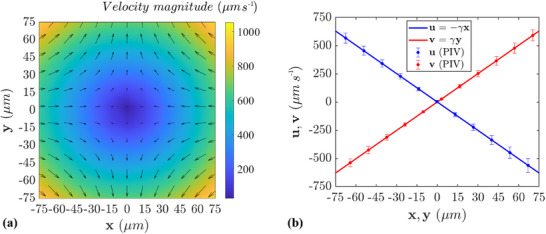
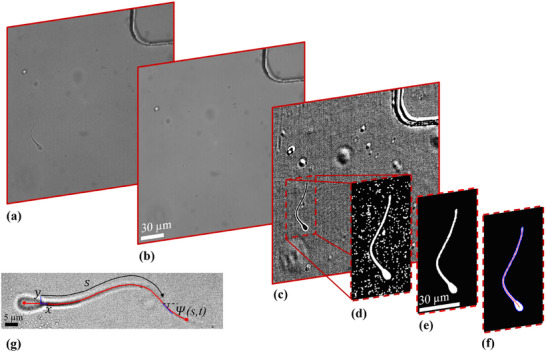
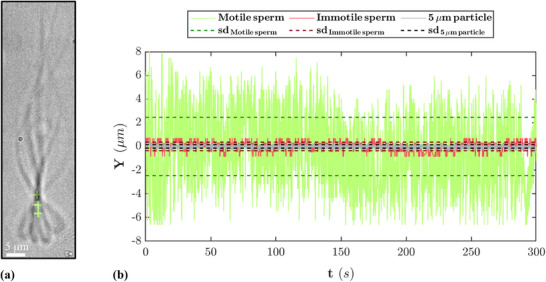
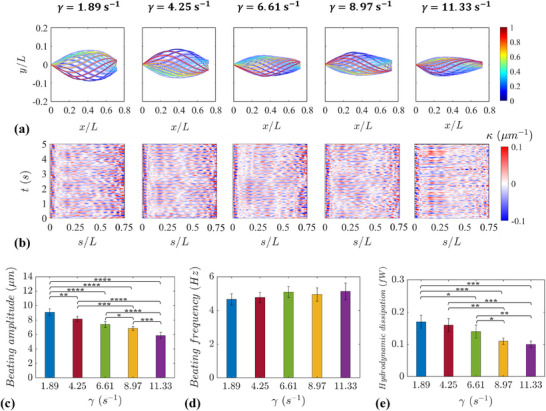
Sperm need to effectively navigate the intricate pathways of the female reproductive tract, which are filled with various complex fluid flows. Despite numerous population-based studies, the effects of flow on the flagellar beating pattern of individual sperm remain poorly understood. In this study, a microfluidic cross-slot trap is employed to immobilize individual motile sperm for an extended period without physical tethering, thereby reducing potential cell damage and movement restriction compared to the conventional head-tethering method. The impact of pure straining flow on trapped single sperm is investigated. The experimental results demonstrate that at strain rates of 11.33 s-1 and higher, the periodic and repetitive beating pattern of the sperm flagellum changes to irregular movement. Furthermore, an increase in strain rate from 1.89 to 11.33 s-1 leads to a 35.4% reduction in beating amplitude and a 41.2% decrease in hydrodynamic power dissipation. These findings underscore the capability of the microfluidic cross-slot platform to trap sperm with high stability, contributing to a better understanding of sperm behavior in response to fluid flows.

Keywords: microfluidic cross‐slot trap; single sperm trapping; sperm flagellar beating behavior; straining flow.


Conflict of interest statement

The authors declare no conflict of interest.

Figures

Figure 1
Figure 1
a) Cross‐slot microchannel design used in present work, originally designed by Akbaridoust et al.,[ 39 ] with the red layer representing the fluidic channel and the yellow layer representing the control channel. b) Side view of deflected variable constriction, illustrating the mechanism causing the change in microchannel height and the displacement of the stagnation point. c) Trapped bull sperm in the pure straining flow. d) Field of view from one frame and its post‐processed binary image captured for the detection and tracking of an object, in this case, bull sperm. The green circle indicates the approximate position of the centroid, which, for bull sperm, is mostly located on the neck. e) Process of manipulation after image processing and detection of the object, involving estimating the centroid location of the closest sperm (green circle) to the center of the microchannel along the outlet direction, displacing the stagnation point (red cross) by changing the pressure in the variable membrane to drag the sperm toward the center, and finally converging the stagnation point and the sperm gradually in the center of cross‐slot and trapping sperm. Different shades of green and red indicate the gradual convergence of the sperm and stagnation point over time.
Figure 2
Figure 2
a) Velocity vectors and magnitude of straining flow in the 150×150 µm2 central region at a flow rate of 70 µl h−1 in the 250 µm microchannel. b) Comparison between the experimental velocities obtained from µPIV and the ideal hyperbolic flow model. The circular dots represent the experimental velocities, while the solid lines indicate the least square fits to the ensemble‐averaged velocities. The error bars display the sd. This comparison shows the deviation from a uniform straining flow in the cross‐slot section.
Figure 3
Figure 3
a) Sample frames taken of trapped sperm under strain. b) Average background c) Detection of the foreground image resulting from subtraction of the original frame from the background. d) The improved region of interest by adjusting light and threshold and applying morphological filters. e) The binary image of the trapped sperm. f) The diagnosed centerline of the bull sperm to analyze its kinematics in response to the strain rate changes. g) The sperm with the extracted flagellar centerline shows the geometric parameters of the tangent angle (Ψ(s, t)) as a function of flagellar arclength (s) and time (t) along the flagellum in the xy coordinate plane.
Figure 4
Figure 4
a) Overlay of five frames from a trapped motile sperm over time. The plus sign represents the variation in the y‐coordinate of the tracked centroid of the sperm head and part of the flagellum. b) The solid lines display all fluctuations of trapped motile sperm, immotile sperm, and a 5 µm particle around the stagnation point over 5 min. The maximum variation of motile sperm is eight times that of the immotile sperm and the 5 µm particle, due to its motility. The dashed lines indicate their respective sd.
Figure 5
Figure 5
a) The variations in the flow rate during experiments were applied by the programmable pump over time. The red vertical lines indicate 5 s duration for which the image series were acquired. b) The two main shape modes plotted against each other created shape cycles of the trapped sperm at different strain rates over time. c) The shape cycles of the same trapped sperm at higher strain rates.
Figure 6
Figure 6
a) The reconstructed mean beat cycles of the trapped sperm flagellum at different strain rates. Each colored line shows the average shape at a particular time of the cycle. The colored bands around each line represent the sd. The x and y coordinates became dimensionless using the sperm length (L). b) The curvature kymograph at various strain rates. s is the arclength along the flagellar centerline that was normalized by L. c) Trapped sperm flagellar beating amplitude, d) beating frequency, and e) hydrodynamic power dissipation at strain rates of 1.89, 4.25, 6.61, 8.97, and 11.33 s−1. The bar presents the value with the sd. The results were also analyzed with the use of the Bonferroni corrected alpha method. P values were determined using Post‐hoc t‐test (****P ⩽0.0001, ***P ⩽0.001, **P ⩽0.01, *P ⩽0.05 for n ⩾10) and shown between each two groups with the significant difference.

Similar articles

References

    1. Tabalvandani M. B., Javadizadeh S., Badieirostami M., Lab Chip 2024, 24, 1636. - PubMed
    1. Nosrati R., Lab Chip 2022, 22, 1680. - PubMed
    1. Nath B., Caprini L., Maggi C., Zizzari A., Arima V., Viola I., Di Leonardo R., Puglisi A., Lab Chip 2023, 23, 773. - PubMed
    1. Simchi M., Riordon J., You J. B., Wang Y., Xiao S., Lagunov A., Hannam T., Jarvi K., Nosrati R., Sinton D., Lab Chip 2021, 21, 2464. - PubMed
    1. Tasoglu S., Safaee H., Zhang X., Kingsley J. L., Catalano P. N., Gurkan U. A., Nureddin A., Kayaalp E., Anchan R. M., Maas R. L., et al., Small 2013, 9, 3374. - PMC - PubMed

LinkOut - more resources