. 2025 Apr 17:14:RP106256.
doi: 10.7554/eLife.106256.

Cholesterol taste avoidance in Drosophila melanogaster

Affiliations

Cholesterol taste avoidance in Drosophila melanogaster

Roshani Nhuchhen Pradhan et al. Elife. .

Abstract

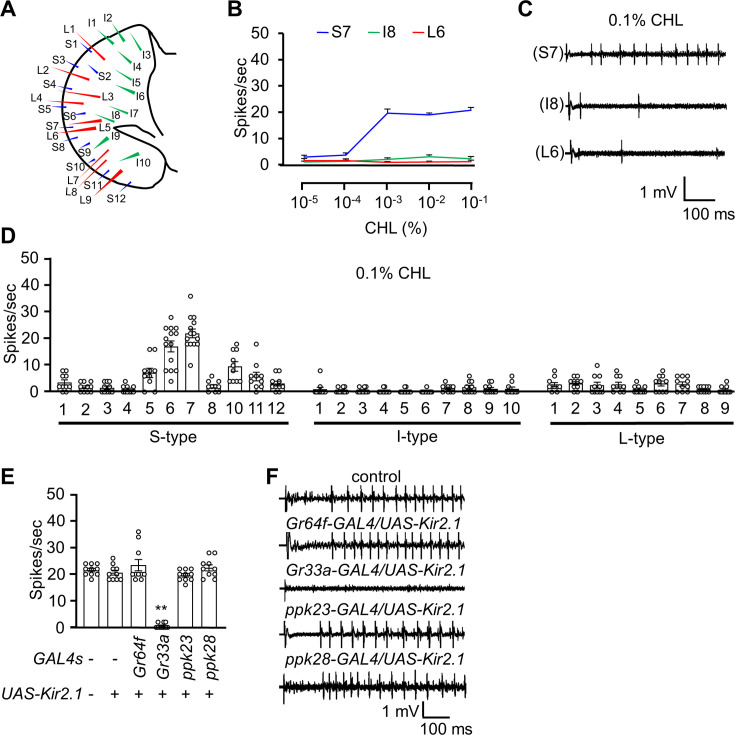
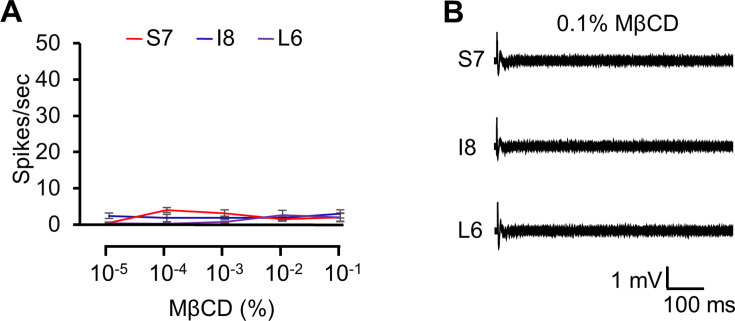
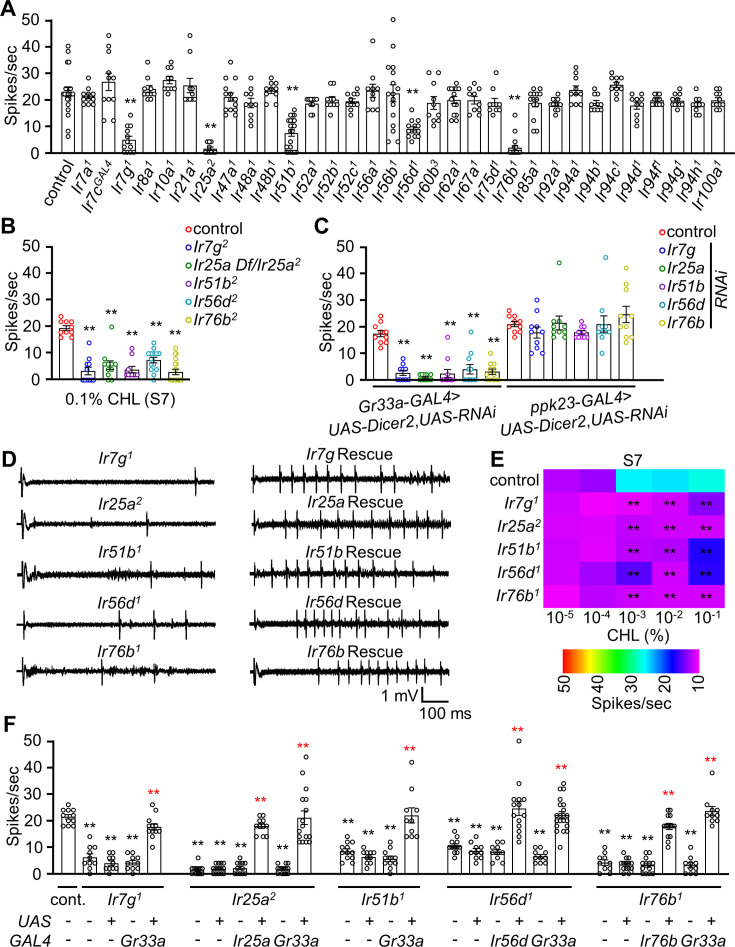
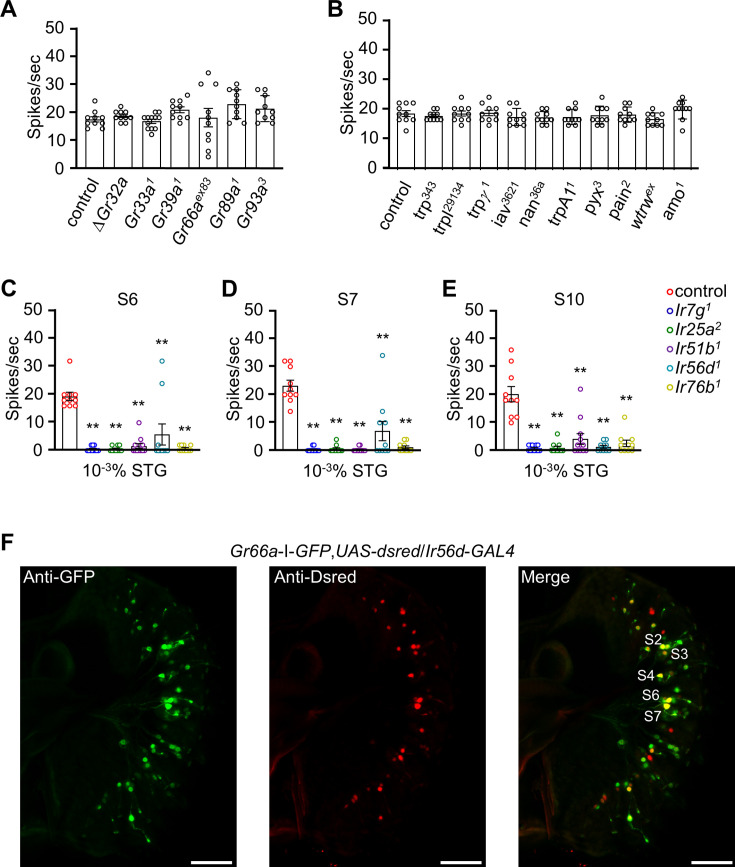
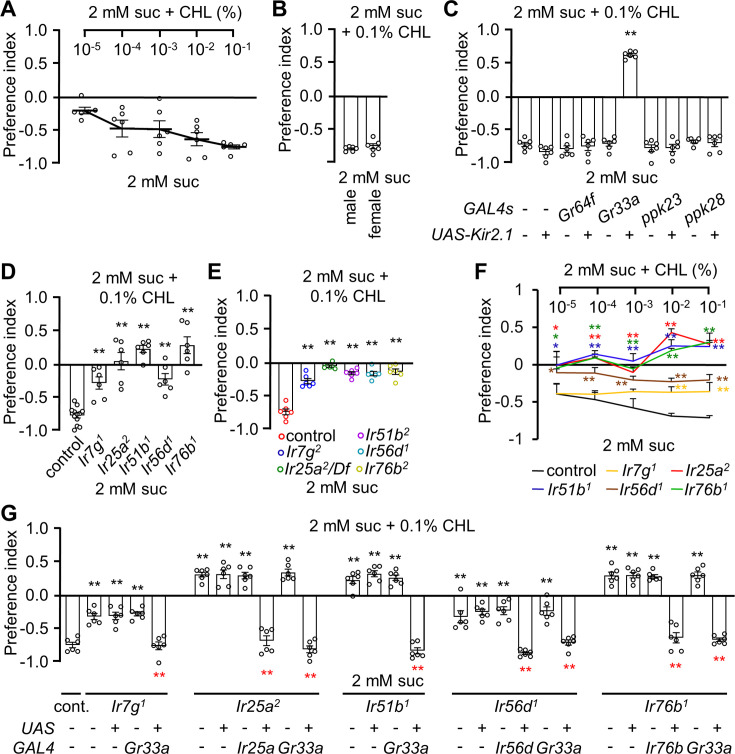
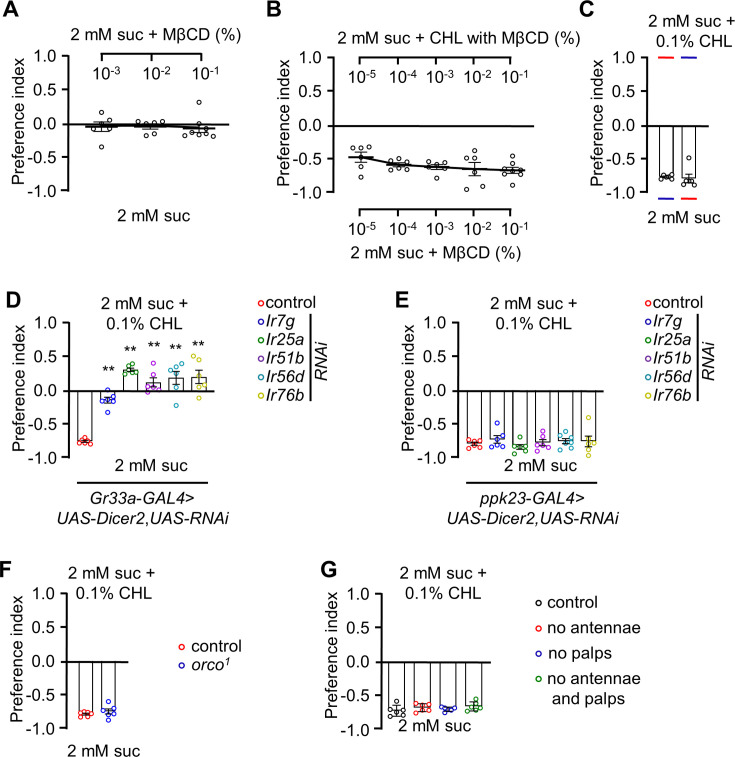
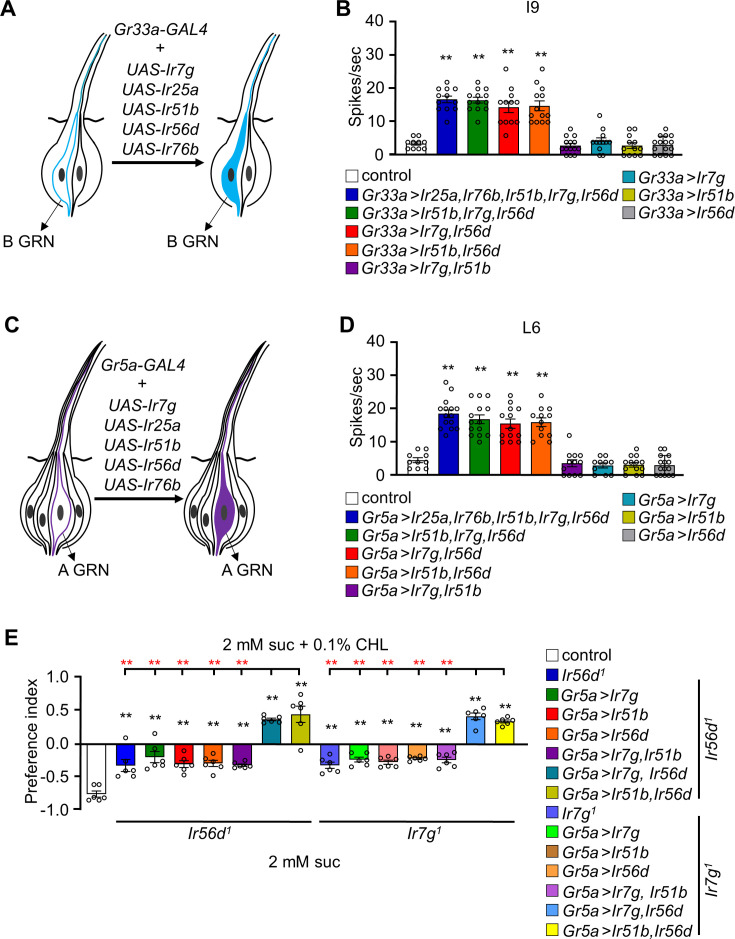
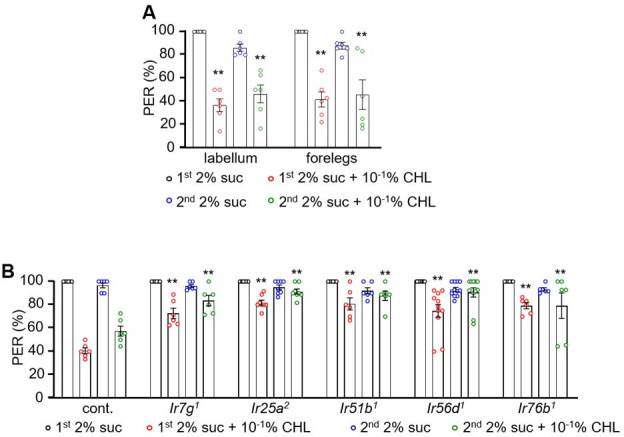
The question as to whether animals taste cholesterol taste is not resolved. This study investigates whether the fruit fly, Drosophila melanogaster, is capable of detecting cholesterol through their gustatory system. We found that flies are indifferent to low levels of cholesterol and avoid higher levels. The avoidance is mediated by gustatory receptor neurons (GRNs), demonstrating that flies can taste cholesterol. The cholesterol-responsive GRNs comprise a subset that also responds to bitter substances. Cholesterol detection depends on five ionotropic receptor (IR) family members, and disrupting any of these genes impairs the flies' ability to avoid cholesterol. Ectopic expressions of these IRs in GRNs reveals two classes of cholesterol receptors, each with three shared IRs and one unique subunit. Additionally, expressing cholesterol receptors in sugar-responsive GRNs confers attraction to cholesterol. This study reveals that flies can taste cholesterol, and that the detection depends on IRs in GRNs.

Keywords: Cholesterol; D. melanogaster; IR51b; IR56d; IR7g; gustatory receptor neurons; neuroscience; taste.


Conflict of interest statement

RN, CM, YL No competing interests declared

Figures

Figure 1.
Figure 1.. The neuronal response of the adult flies to cholesterol.
(A) Schematic diagram of the fly labellum. (B) Average frequencies of action potential generated from S7, I8, and L6 sensilla upon application of different concentrations of cholesterol (CHL; n=10–12). (C) Representative sample traces of S7, I8, and L6 from (B). (D) Electrophysiological responses of control flies produced from all labellum sensilla in response to 0.1% cholesterol (n=10–12). (E) Electrophysiological analysis of S7 sensilla in response to 0.1% cholesterol using flies in which different GRNs were inactivated by the inwardly rectifying potassium channel Kir2.1 (n=10–12). (F) Representative sample traces of the S7 sensilla from (E). All error bars represent SEMs. Single-factor ANOVA was combined with Scheffe’s post hoc analysis to compare multiple datasets. Asterisks indicate statistical significance compared to the control group (**p<0.01).
Figure 1—figure supplement 1.
Figure 1—figure supplement 1.. Electrophysiological responses using different doses of methyl-β-cyclodextrin (MβCD).
(A) Dose-dependent neuronal responses of w1118 adult flies to MβCD from S7, I8, and L6 sensilla (n=10). (B) Representative sample traces corresponding to the data in (A). Error bars represent standard errors of the means (SEMs). Statistical analysis was performed using single-factor ANOVA with Scheffe’s post hoc analysis to compare multiple datasets.
Figure 2.
Figure 2.. Ionotropic receptors (IRs) are responsible for sensing cholesterol.
(A) Tip recordings using 0.1% cholesterol to analyze the responses of S7 sensilla from control flies and from 32 Ir mutants (n=10–16). (B) Tip recordings using 0.1% cholesterol to analyze responses of S7 sensilla from Ir7g2, Ir25a Df/Ir25a2, Ir51b2, Ir56d2, and Ir76b2 (n=10–16). (C) Tip recordings using 0.1% cholesterol to analyze responses of S7 sensilla after RNAi knockdown of the following genes using either the Gr33a-GAL4 or ppk23-GAL4: Ir7g, Ir25a, Ir51b, Ir56d, and Ir76b. (D) Representative sample traces of (F) for control, mutants, and rescue lines using the GAL4/UAS system. (E) Heatmap representing the dose responses (spikes/sec) elicited by S7 sensilla from the control and the indicated mutants (Ir7g1, Ir25a2, Ir51b1, Ir56d1, and Ir76b1) (n=10–16). (F) Tip recordings performed on S7 sensilla (0.1% cholesterol) from control, Ir7g1, Ir25a2, Ir51b1, Ir56d1, Ir76b1, and from flies expressing the indicated cognate transgenes under control of either their own GAL4 or the Gr33a-GAL4 (n=10–14). All error bars represent SEMs. Single-factor ANOVA was combined with Scheffe’s post hoc analysis to compare multiple datasets. Black asterisks indicate statistical significance compared to the control group. The red asterisks indicate statistical significance between the control and the rescued flies (**p<0.01).
Figure 2—figure supplement 1.
Figure 2—figure supplement 1.. Electrophysiological analyses of S7 sensilla from mutants disrupting different bitter GRs andTRP channels in the presence of 10–1% CHL, and a subset of bitter GRNs express Ir56d .
(A) Tip recordings from S7 sensilla (using 0.1% cholesterol) from mutants disrupting broadly tuned bitter GRs (n=10). (B) Neuronal response analyses from S7 sensilla from trp mutant lines using 0.1% cholesterol (n=10). (C, D, E) Tip recording analyses of control flies and candidate Irs mutant flies (Ir7g1, Ir25a2, Ir51b1, Ir56d1, and Ir76b1) with 10–3% stigmasterol (STG) from S6, S7, and S10 sensilla (n=10–12). (F) Relative spatial distributions of the Gr66a (green; anti-GFP) and Ir56d (red; anti-DsRed) reporters in the labella of Gr66a-I-GFP, Ir56d-GAL4/UAS-DsRed flies. Images were acquired by confocal microscopy. The scale bars represent 50 µm. All error bars represent SEMs. Statistical analysis was performed using single-factor ANOVA with Scheffe’s post hoc analysis to compare multiple datasets. Asterisks indicate statistical significance compared to the control group (**p<0.01).
Figure 3.
Figure 3.. Ir7g, Ir25a, Ir51b, Ir56d, and Ir76b are required for the perception of cholesterol.
(A) Binary food choice analysis of w1118 adult flies toward different doses of cholesterol. Sucrose (2 mM) was included on both sides (n=6). (B) Binary food choice analyses to test for sex-specific difference in the feeding responses toward 0.1% cholesterol (n=6). (C) Binary food choice assays to determine the effects of inactivating different GRN types on the responses to 0.1% cholesterol. +/-indicates the presence or absence of the transgene, respectively (n=6). (D) Binary food choice assays to test the reponses of Ir7g1, Ir25a2, Ir51b1, Ir56d1, and Ir76b1 flies to 0.1% cholesterol (n=6). (E) Binary food choice assays to analyze the responses of Ir7g2, Ir25a Df, Ir51b2, Ir56d2, and Ir76b2 flies to 0.1% cholesterol (n=6). (F) Dose responses of control, Ir7g1, Ir25a2, Ir51b1, Ir56d1, and Ir76b1 flies to different concentrations of cholesterol (10–5%, 10–4%, 10–3%, 10–2%, and 10–1%) via binary food choice assays (n=6). (G) Rescue of Ir7g1, Ir25a2, Ir51b1, Ir56d1, and Ir76b1 defects by expressing the wild-type cDNAs under the control of the GAL4 drivers specific to each gene (Ir25a, Ir56d, and Ir76b) or Gr33a-GAL4 (n=6). All error bars represent SEMs. Single-factor ANOVA was combined with Scheffe’s post hoc analysis to compare multiple datasets. Black asterisks indicate statistical significance compared to the control group. The red asterisks indicate statistical significance between the control and the rescued flies (**p<0.01).
Figure 3—figure supplement 1.
Figure 3—figure supplement 1.. Binary food choice assays with CHL and methyl-β-cyclodextrin (MβCD).
(A) Dose-dependent binary food choice assays using control flies with 10–3%, 10–2%, and 10–1% MβCD containing 2 mM sucrose vs 2 mM sucrose only (n=6). (B) Dose-dependent binary food choice assay comparing cholesterol (CHL) vs MβCD food. Sucrose (2 mM) was employed on both sides (n=6). (C) Behavioral analysis of control flies after switching the red and blue dyes in the two food options (n=6). (D) Binary food choice assays using flies expressing UAS-RNAi lines for Ir7g, Ir25a, Ir51b, Ir56d, and Ir76b with combined with UAS-Dicer2 and driven by the Gr33a-GAL4. (E) Binary food choice assays using flies expressing UAS-RNAi lines for Ir7g, Ir25a, Ir51b, Ir56d, and Ir76b combined with UAS-Dicer2 and driven by the ppk23-GAL4 (n=6). (F) Binary food choice assays using control flies and orco1 mutants (n=6). (G) Evaluation of the role of olfactory organs in rejecting 0.1% cholesterol using binary food choice assays (n=6). All error bars represent SEMs. Statistical analysis was performed using single-factor ANOVA with Scheffe’s post hoc analysis to compare multiple datasets. Asterisks indicate statistical significance compared to the control group (**P<0.01).
Figure 4.
Figure 4.. Testing whether ectopic expression of Ir7g, Ir25a, Ir51b, Ir56d, and Ir76b in L- and I-type sensilla confers cholesterol responsiveness.
(A) Schematic representation of ectopic expression of Irs in B GRNs under control of the Gr33a-GAL4. (B) Tip recordings conducted from I9 sensilla with 0.1% cholesterol using flies overexpressing UAS-Ir7g, UAS-Ir25a, UAS-Ir51b, UAS-Ir56d, and UAS-Ir76b in B GRNs under control of the Gr33a-GAL4 (n=10–16). (C) Schematic presentation of misexpression of Irs in A GRNs under control of the Gr5a-GAL4. (D) Tip recordings from L6 sensilla of the indicated flies expressing the indicated Irs under control of the Gr5a-GAL4 (n=10–16). (E) Binary food choice assays testing for attraction or aversion to 0.1% cholesterol in flies misexpressing Ir7g, Ir51b, and Ir56d in A GRNs (Gr5a-GAL4). The Irs were ectopically expressed in either an Ir56d1 or Ir7g1 mutant background (n=6). The red asterisks indicate the comparison of the combination of two UAS lines (Ir7g, Ir56d and Ir51b, Ir56d) driven by Gr5a-GAL4 with all the single UAS line including the combination of Ir7g and Ir51b. All error bars represent SEMs. Single-factor ANOVA was combined with Scheffe’s post hoc analysis to compare multiple datasets. Black asterisks indicate statistical significance compared with the control (**p<0.01).
Author response image 1.

Update of

  • doi: 10.1101/2025.02.20.639355
  • doi: 10.7554/eLife.106256.1

Similar articles

Cited by

References

    1. Ahn JE, Chen Y, Amrein H. Molecular basis of fatty acid taste in Drosophila. eLife. 2017;6:e301. doi: 10.7554/eLife.30115. - DOI - PMC - PubMed
    1. Akitake B, Ren Q, Boiko N, Ni J, Sokabe T, Stockand JD, Eaton BA, Montell C. Coordination and fine motor control depend on Drosophila TRPγ. Nature Communications. 2015;6:7288. doi: 10.1038/ncomms8288. - DOI - PMC - PubMed
    1. Al-Anzi B, Tracey WD, Jr, Benzer S. Response of Drosophila to wasabi is mediated by painless, the fly homolog of mammalian TRPA1/ANKTM1. Current Biology. 2006;16:1034–1040. doi: 10.1016/j.cub.2006.04.002. - DOI - PubMed
    1. Aryal B, Dhakal S, Shrestha B, Lee Y. Molecular and neuronal mechanisms for amino acid taste perception in the Drosophila labellum. Current Biology. 2022a;32:1376–1386. doi: 10.1016/j.cub.2022.01.060. - DOI - PubMed
    1. Aryal B, Dhakal S, Shrestha B, Sang J, Nhuchhen Pradhan R, Lee Y. Protocol for binary food choice assays using Drosophila melanogaster. STAR Protocols. 2022b;3:101410. doi: 10.1016/j.xpro.2022.101410. - DOI - PMC - PubMed

MeSH terms

LinkOut - more resources