. 2025 Apr 17;21(4):e1012865.
doi: 10.1371/journal.pcbi.1012865. eCollection 2025 Apr.

Modeling diffusive search by non-adaptive sperm: Empirical and computational insights

Affiliations

Modeling diffusive search by non-adaptive sperm: Empirical and computational insights

Benjamin M Brisard et al. PLoS Comput Biol. .

Abstract

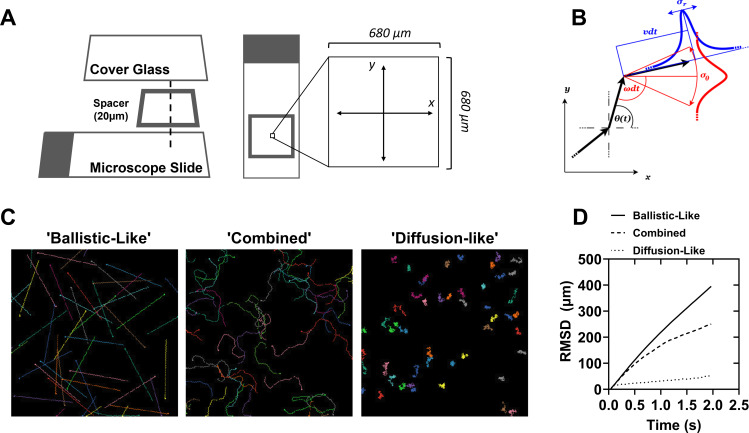
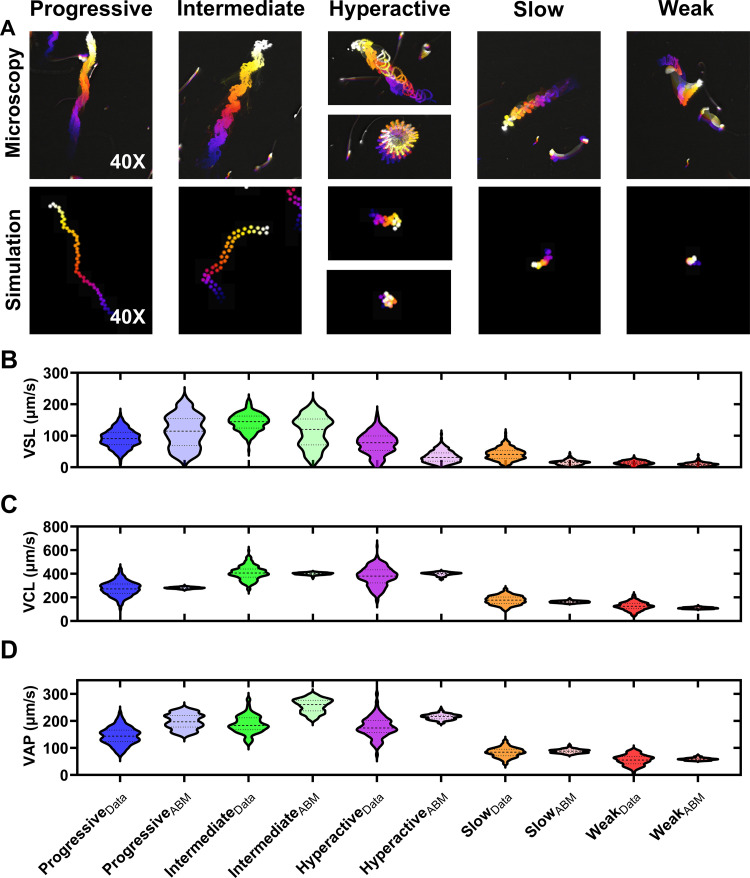
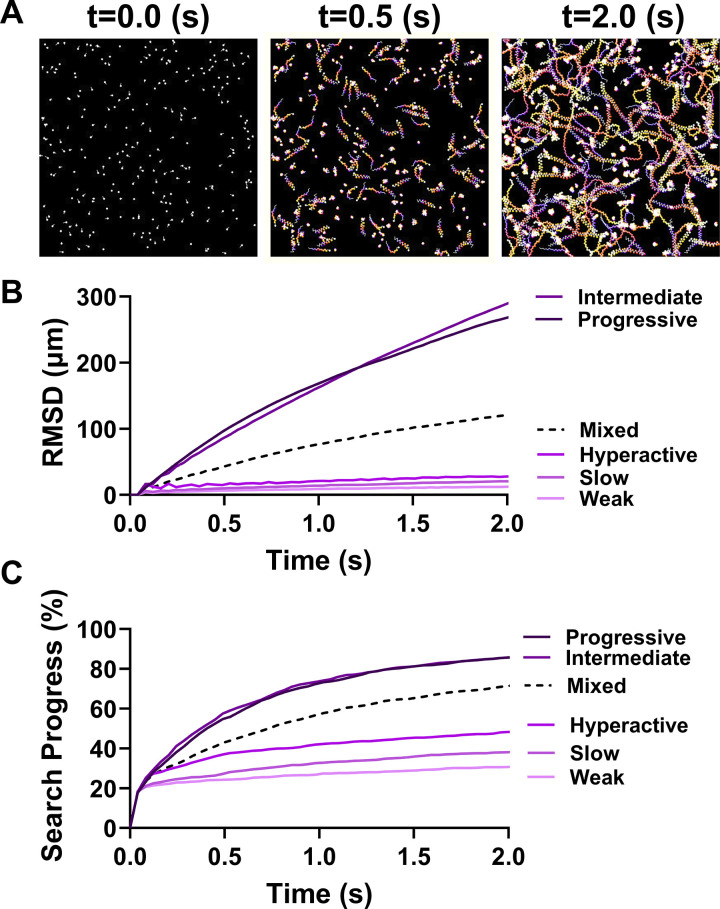
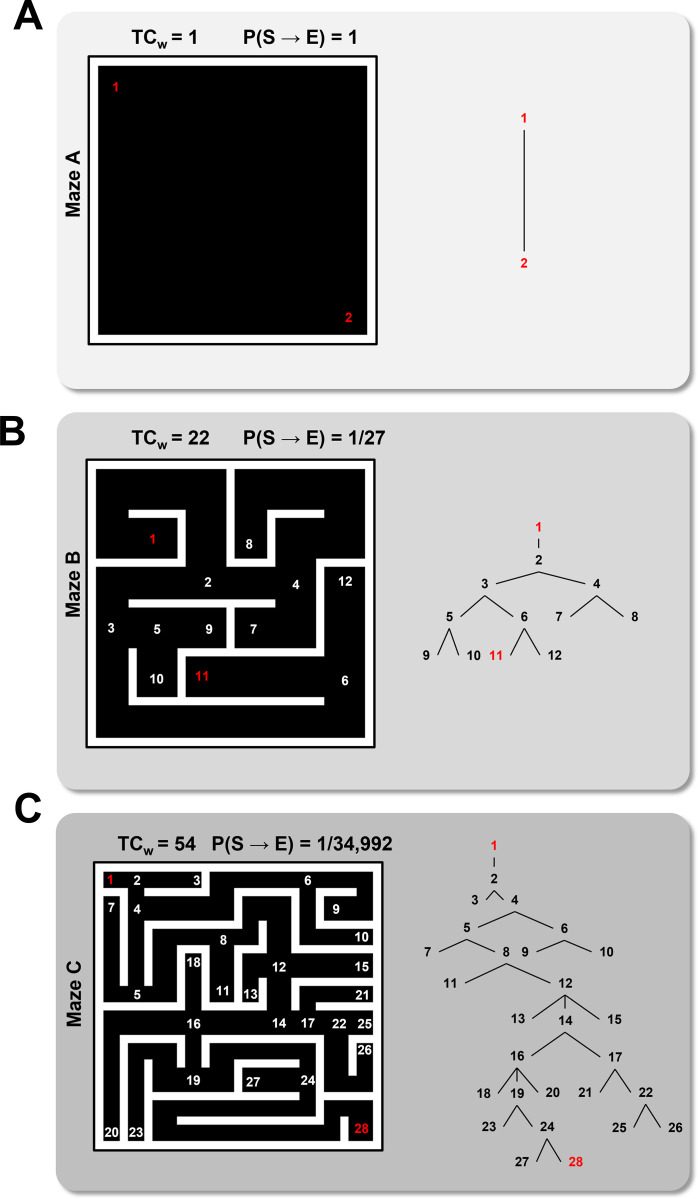
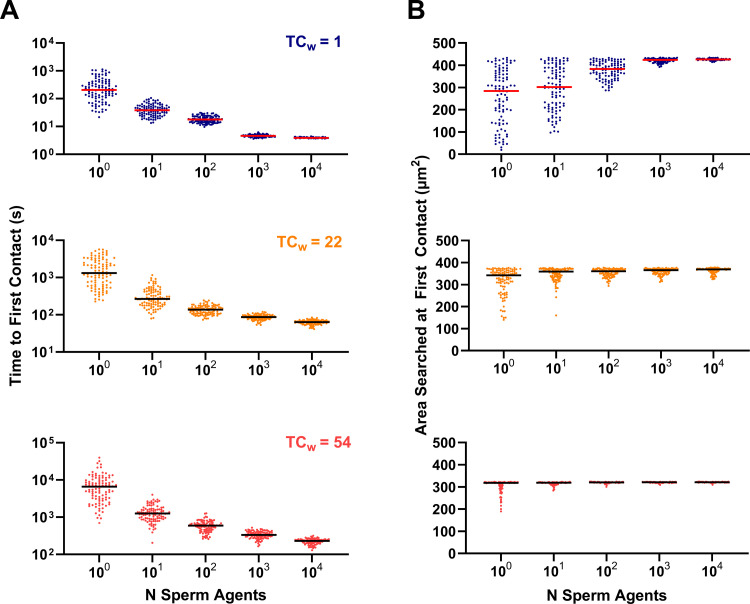
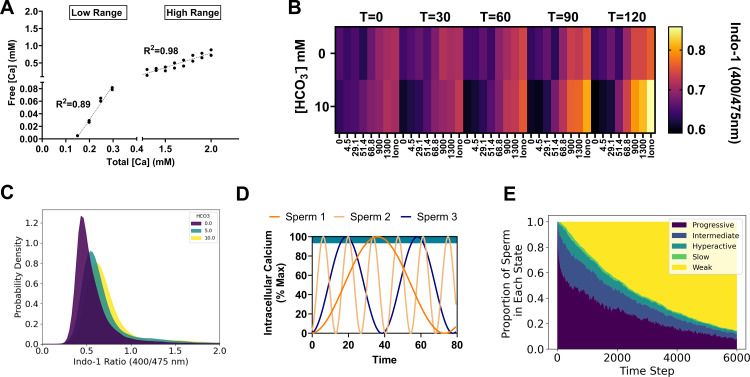
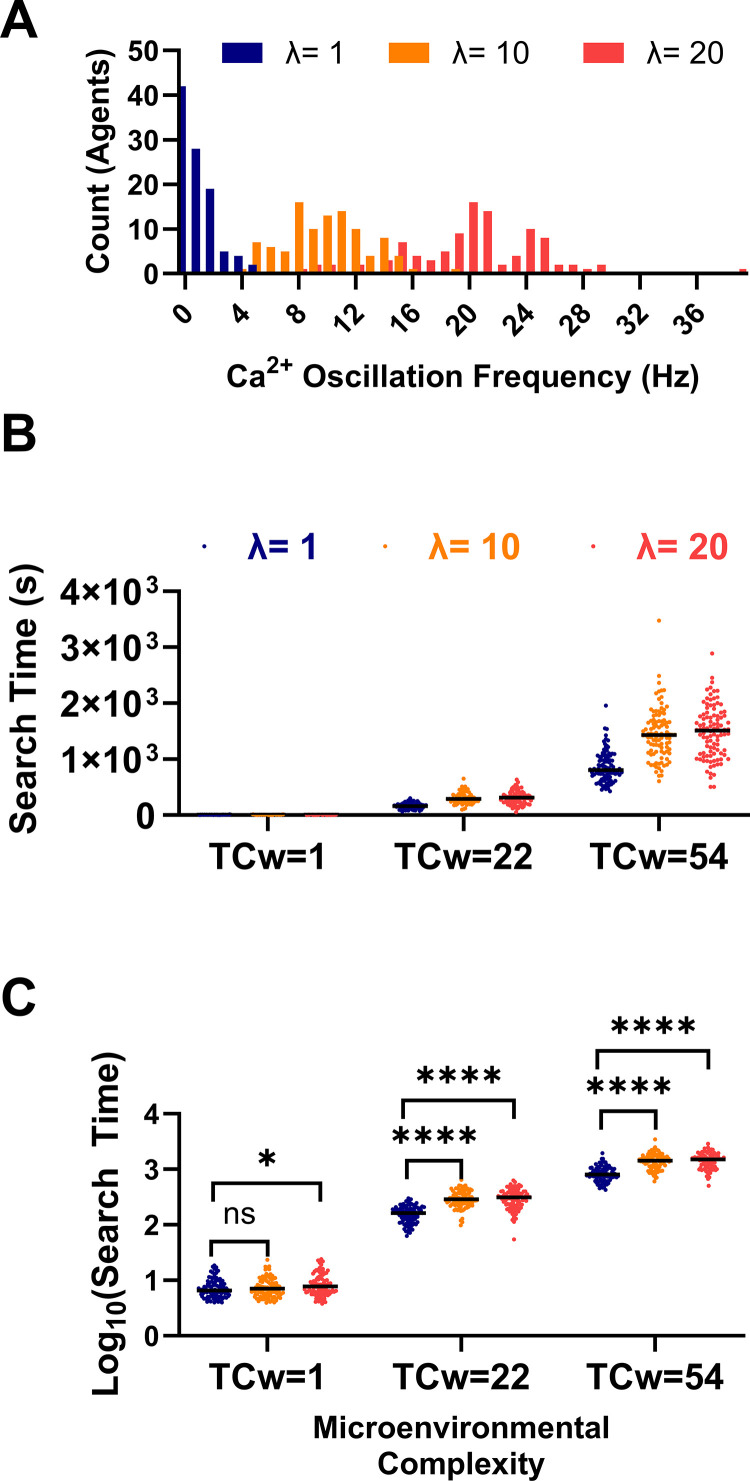
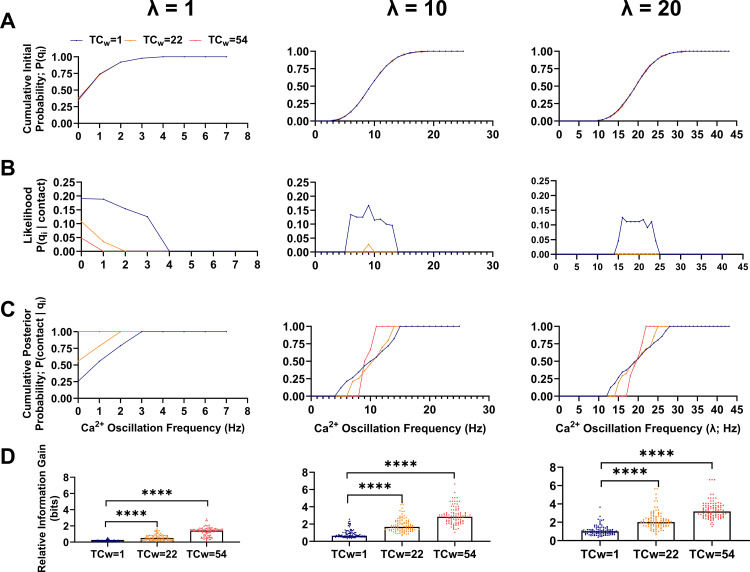
During fertilization, mammalian sperm undergo a winnowing selection process that reduces the candidate pool of potential fertilizers from ~106-1011 cells to 101-102 cells (depending on the species). Classical sperm competition theory addresses the positive or 'stabilizing' selection acting on sperm phenotypes within populations of organisms but does not strictly address the developmental consequences of sperm traits among individual organisms that are under purifying selection during fertilization. It is the latter that is of utmost concern for improving assisted reproductive technologies (ART) because low-fitness sperm may be inadvertently used for fertilization during interventions that rely heavily on artificial sperm selection, such as intracytoplasmic sperm injection (ICSI). Importantly, some form of sperm selection is used in nearly all forms of ART (e.g., differential centrifugation, swim-up, or hyaluronan binding assays, etc.). To date, there is no unifying quantitative framework (i.e., theory of sperm selection) that synthesizes causal mechanisms of selection with observed natural variation in individual sperm traits. In this report, we reframe the physiological function of sperm as a collective diffusive search process and develop multi-scale computational models to explore the causal dynamics that constrain sperm fitness during fertilization. Several experimentally useful concepts are developed, including a probabilistic measure of sperm fitness as well as an information theoretic measure of the magnitude of sperm selection, each of which are assessed under systematic increases in microenvironmental selective pressure acting on sperm motility patterns.


Conflict of interest statement

The authors have declared that no competing interests exist

Figures

Fig 1
Fig 1. Simulated random walkers explore space in a manner that depends on their movement properties.
(A) Diagram of the model environment, which is designed to emulate an isolated portion of the field of view of a light microscope with a 10X objective and a 20 µm deep chambered glass microscope slide. (B) Diagram of the core movement functions employed by the agent-based model. Θ(t) is the angular rate of change, ν(t) is the radial rate of change, σ is the respective amplitudes of zero average Gaussian noise added to the parameters. (C) Example images of simulations highlighting extremes of model behavior based on the choice of parameters. Ballistic-like motion results from no Gaussian noise being added to the radial and angular velocities; Combined motion results from combinations of the radial and angular velocities as well as the amplitude of noise added to each term; Diffusion-like motion results from relatively large values of noise amplitude. (D) Root mean square displacement of simulations with 50 agents as a measure of the relative distance traveled by the particles on average from their point of origin after 50 steps. Colors are randomly assigned to the agents and serve only to facilitate distinguishing the trajectories.
Fig 2
Fig 2. Parameter Estimation for the Sperm Motility Patterns.
(A) Temporally coded phase contrast images of mouse sperm motility patterns (top row). Matching temporally coded images of simulated sperm-agents for each sperm motility type (bottom row). Color scale is blue (early) to white (late) frames in the video. Simulated trajectories (B) Consensus data from published studies were used to generate normal distributions of curvilinear velocity (VCL) values (indicated by the subscript ‘Data’). Parameters (i.e., ν(t), θ(t), σr, and σθ) of each motility type in the agent-based models (i.e., subscript- ABM) were adjusted to approximate the mean VCL values with those identified in the data distributions. N = 250 data points for all groups.
Fig 3
Fig 3. Sperm-Agent Search is a Function of Ensemble Motility Pattern.
(A) Representative model simulation of 250 sperm with equal proportions of each motility type searching a closed space. Color scale is blue (early) to white (late) frames in the video. (B) Root mean squared displacement (µm) for simulations involving the indicated composition of motility types. Mixed populations consisted of 50 sperm of each motility type. (C) Search progress (%) for the simulations described in subpanel (B).
Fig 4
Fig 4. Modeling Microenvironmental Complexity.
(A) The simplest simulation microenvironment consisting of an open space with an egg located in the bottom right corner. Sperm begin at position 1 (red) and end at the egg position 2 (red). TCw = total weighted complexity, a measure of the graph complexity of the maze. P(S→E)  = the probability of a sperm taking the shortest direct path to the egg. (B) A more complex maze with increased TCw relative to maze A. (C) The most complex maze used in the simulations. Mazes were constructed using a separate agent-based model in Netlogo. Vertex numbers are indicated on the maze diagrams. Graph networks with numbered vertices connected by edges are shown on the right.
Fig 5
Fig 5. Sperm Number and Search Properties.
(A) Time to first contact with an egg in microenvironments with TCw = 1 (maze A), TCw = 22(maze B), and TCw = 54 (maze C). (B) Area (µm2) searched at first contact with the egg for microenvironments with increasing weighted complexity (top to bottom as in subpanel A). Lines indicate the median. N = 100 simulations for each condition.
Fig 6
Fig 6. A Time-Homogeneous Markov Model of Sperm Phenotype Heterogeneity:
(A) Linear regression curves for different calcium ion selective electrode filling solutions used to calculate the free Ca2+ concentrations in HEPES buffered assay media in the presence of 1mM EGTA. (B) Representative heat map showing Indo-1 fluorescence ratios for sperm under the indicated Ca2+ and HCO3- pseudo-titration conditions. Iono = ionomycin. Free calcium concentrations (bottom) are in micromolar units. T = time since the beginning of the assay in minutes. (C) Probability density estimate from spectral flow cytometry for approximately 105 live cells per indicated condition. Dead cells were excluded from analysis based on ToPro3 fluorescence intensity. (D) Representative intracellular calcium oscillations derived from a squared sine function assigned to each sperm in the model simulations. Teal bar at the top of the graph indicates the upper 5% of the concentration range during which the cells were allowed to transition motility states according to a Markov probability transition table. (E) Relative proportion of sperm in each indicated motility state over time (in model-timestep units). In the long run, sperm in the models absorbed into a weak motility state.
Fig 7
Fig 7. Impact of Sperm Phenotype Heterogeneity on Diffusive Search.
(A) Histogram of the sperm intracellular calcium oscillation frequencies randomly drawn from a Poisson distribution with the indicated means (λ). (B) Search time for sperm populations with different phenotype distributions in microenvironments with increasing total weighed complexity (TCw). (C) Logarithmically transformed search times from subplot B used for statistical analysis to satisfy 2-way ANOVA assumptions. Ns = not significant, *p < 0.05, ****p < 0.0001. Lines indicate medians. Simulations consisted of N = 100 agents.
Fig 8
Fig 8. Measures to Infer Sperm Fitness as well as Quantify the Magnitude of Sperm Selection.
(A) Cumulative distributions total probability P(qi) for each oscillation frequency in the initial sperm population for each simulation condition. (B) The Bayesian likelihood (frequency of sperm for each oscillation frequency that contacted the egg). (C) Cumulative posterior probability of egg contact for each oscillation frequency. Note, a prior distribution of 1/N, where N is the total number of sperm in the simulation, was used in the calculation. This can be interpreted to mean that each sperm had an assumed equal chance of contacting the egg. (D) Relative information gain (a.k.a. Kullback-Leibler divergence) calculated for each simulation condition. ****p < 0.0001. TCw = total weighted complexity. N = 100 sperm in each simulation. Points in A-C represent the median of 100 simulations. Points in D represent relative information gain for each of 100 simulations.

Update of

Similar articles

Cited by

References

    1. Kandel ME, Rubessa M, He YR, Schreiber S, Meyers S, Matter Naves L, et al.. Reproductive outcomes predicted by phase imaging with computational specificity of spermatozoon ultrastructure. Proc Natl Acad Sci U S A. 2020;117(31):18302–9. doi: 10.1073/pnas.2001754117 - DOI - PMC - PubMed
    1. You JB, McCallum C, Wang Y, Riordon J, Nosrati R, Sinton D. Machine learning for sperm selection. Nat Rev Urol. 2021;18(7):387–403. doi: 10.1038/s41585-021-00465-1 - DOI - PubMed
    1. Oehninger S, Franken DR, Ombelet W. Sperm functional tests. Fertil Steril. 2014;102(6):1528–33. doi: 10.1016/j.fertnstert.2014.09.044 - DOI - PubMed
    1. Buffone MG, Doncel GF, Marín Briggiler CI, Vazquez-Levin MH, Calamera JC. Human sperm subpopulations: relationship between functional quality and protein tyrosine phosphorylation. Hum Reprod. 2004;19(1):139–46. doi: 10.1093/humrep/deh040 - DOI - PubMed
    1. Puga Molina LC, Luque GM, Balestrini PA, Marín-Briggiler CI, Romarowski A, Buffone MG. Molecular basis of human sperm capacitation. Front Cell Dev Biol. 2018;6:72. doi: 10.3389/fcell.2018.00072 - DOI - PMC - PubMed

LinkOut - more resources