. 2025 Apr 17;21(4):e1012936.
doi: 10.1371/journal.pcbi.1012936. eCollection 2025 Apr.

Mycobacterium susceptibility to ivermectin by inhibition of eccD3, an ESX-3 secretion system component

Affiliations

Mycobacterium susceptibility to ivermectin by inhibition of eccD3, an ESX-3 secretion system component

Ana Laura Granados-Tristán et al. PLoS Comput Biol. .

Abstract

Drug-resistant tuberculosis is a pressing global health issue that requires the development of new drugs or the identification of new therapeutic targets. The ESX-3 secretion system is essential for the Mycobacterium tuberculosis growth and plays a role in iron/zinc homeostasis and virulence. The aim of this study was to evaluate the quaternary interface of EccD3, a component of the ESX-3 secretion system, and to evaluate the association of an eccD3 mutant with drug resistance. The molecular structures of EccD3 protein and other ESX-3 secretion system proteins of the M. tuberculosis were predicted based in homology with the Mycolicibacterium smegmatis tertiary protein structures. According to the in silico results, selamectin, avermectin, ivermectin, and moxidectin were selected as prospective drugs. Selamectin and moxidectin had favorable ΔG values for the EccB3 and EccD3 dimer interfaces, whereas the ESX-3 Protomer 1 interface had the best ΔG + with avermectin, ivermectin, and moxidectin. Furthermore, ivermectin susceptibility increased when the eccD3 gene was inhibited using CRISPRi in M. smegmatis. Blockage of EccD3 increased the ivermectin action, but the modest changes observed may be explained by the compensatory mechanisms or other ivermectin targets in absence of this Esx3 component. Further in vitro and preclinical studies are required to validate our findings.


Conflict of interest statement

The authors have declared that no competing interests exist.

Figures

Fig 1
Fig 1. M. tuberculosis EccD3 and ESX-3 secretion system models and drug binding site search space.
(a) and (b) N- terminal and C-terminal at the quaternary interfaces of EccD3 dimer. (c) Quaternary structure of M. tuberculosis of ESX-3 secretion system, using homology models of proteins. EccD3-1 represents bent monomer, EccD3-2 represents extended monomer, DUF represents EccC3 domain of unknown function. (d) Quaternary interface of protomer 1 and protomer 2. (e) Quaternary interface of periplasmic EccB3 dimer. (f) Active drug binding site of ATP in the EccC3 ATPase III domain (1-PDB ID: 6J17) [29]. Quaternary interface amino acids defining the search space are shown in red.
Fig 2
Fig 2. Target-ligand Z-score heat-map based on the lowest ΔG found for each of the six search locations against the 34 drugs.
Analysis by columns (independent statistical analysis for each intersection location). Z-score values show in a blue-red gradient, being represented in blue when the Z-score is below the mean and in red when the Z-score is above the mean, if the Z-score approaches to the mean it appears white (S4 Table).
Fig 3
Fig 3. M. tuberculosis ESX-3 EccD3 domain.
(a) EccD3 N-terminal and EccD3 C-terminal interactions with the nine drugs having Z-score values less than -1. D, Molecular interactions between EccD3 interface residues and (b) selamectin, (c) moxidectin, and (d) rifalazil in 2D diagram. Ligplot was used for 2D map.
Fig 4
Fig 4. M. tuberculosis ESX-3 periplasmic domain EccB3.
(a) EccB3 interactions with the five drugs having Z-scores values less than -1. (b) EccB3 dimer interface interaction with selamectin. (c) Molecular interactions between EccB3 interface residues and selamectin in 2D diagram. Ligplot was used for 2D map.
Fig 5
Fig 5. M. tuberculosis ESX-3 secretion system protomer 1.
(a) Protomer 1 interactions with the five drugs having Z-score values less than -1. Molecular interactions between Protomer 1 interface amino acids with (b) ivermectin, (c) moxidectin, and (d) avermectin in 2D diagram. Ligplot was used for 2D map. EccD3-1, refers to extended monomer and EccD3-2, refers to bent monomer.
Fig 6
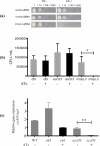
Fig 6. Characterization of CRISPRi M. smegmatis strains.
(a) Representative image of M. smegmatis strains cultures (PLJR962-eccD3-gRNA, PLJR962-control-gRNA and PLJR962-mmpL3-gRNA) grown in 7H10 medium supplemented with OADC, kanamycin 0.03 µM (20 μg/mL) and without or with ATc. (b) A significant difference in growth was observed in M. smegmatis PLJR962-mmpL3-gRNA strain without or with ATc, using Student’s t-test (p= 0.0168) bars represent the average of the replicates and error bars illustrate standard deviation of the data. (c) Relative expression of eccD3 gene, average of technical triplicates of each strain without (-) and with (+) ATc (anhydrotetracycline) 0.0002 μM (100 ng/mL). For (b) and (c) eccD3 corresponds to M. smegmatis PLJR962-eccD3-gRNA strain, ctrl corresponds to M. smegmatis PLJR962-control-gRNA strain, WT corresponds to M. smegmatis wild type strain and mmpL3 corresponds to M. smegmatis PLJR962-mmpL3-gRNA. The rod with the asterisk shows significant differences between the relative expression of eccD3 gene in M. smegmatis PLJR962-eccD3-gRNA strain using Student’s t-test (p=0.0062).
Fig 7
Fig 7. Growth curve of M. smegmatis PLJR962-eccD3-gRNA strain with ivermectin.
Growth curves of M. smegmatis mc2 155 wild type strain (diamonds, inner graph (a) and (c), M. smegmatis PLJR962-eccD3-gRNA strain (circles) (a) and (b), and M. smegmatis PLJR962-control-gRNA strain (triangles) (c) and (d) without ATc (gray line) and with ATc (black line) 0.0002 μM (100 ng/mL), and with a final concentration of ivermectin of 0.062 μM 64 μg/mL) (a) and (c) and 0.031 μM (32 μg/mL) (b) and (d), and 0.03 μM (20 μg/mL) of kanamycin. In the two ivermectin concentrations tested in M. smegmatis PLJR962-eccD3-gRNA strain, a significant difference was observed among treatments with and without ATc from 20 to 27 hours. An unpaired two-tailed Student’s t-test was used and p < 0.001 (***) and p <0.05 (*) were obtained (S7 Table and MDdb Science Gateway at http://md-db.org with entry ID 690005 in-vitro data). M. smegmatis mc2 155 wild type growth curve were included in the inner graph. Each assay was performed with technical triplicates showing the average data with the standard deviation as error bars.
Fig 8
Fig 8. Growth curve of M. smegmatis PLJR962-eccD3-gRNA strain with linezolid and rifampicin.
Growth curves of M. smegmatis mc2 155 wild type strain (diamonds, inner graph a and b), M. smegmatis PLJR962-eccD3-gRNA strain (circles) (a) and (b) without (gray line) and with (black line) ATc 0.0002 μM (100 ng/mL), and M. smegmatis PLJR962-control-gRNA strain (triangles) (c and d) without (gray line) and with (black line) ATc 0.0002 μM (100 ng/mL), and with a final concentration of linezolid of 0.001 µM (0.5 μg/mL) (a), and with a final concentration of rifampicin of 0.03 μM (0.8 μg/mL) (b), and (20 μg/mL) of kanamycin. A significant difference was observed in the linezolid and rifampicin concentrations in M. smegmatis PLJR962-eccD3-gRNA strain without or with ATc from 20 to 27 hours. An unpaired two-tailed Student’s t-test was used and p < 0.01 (**) were obtained (S8 Table and MDdb Science Gateway at http://md-db.org with entry ID 690005 in-vitro data). M. smegmatis mc2 155 wild type growth curve were included in the inner graph. Each experiment was performed in technical triplicates showing the average data with the standard deviation.

Similar articles

References

    1. WHO. Global tuberculosis report. 2023.
    1. Parums DV. Editorial: updates from the World Health Organization (WHO) on global treatment recommendations for drug-susceptible and multidrug-resistant tuberculosis. Med Sci Monit. 2021;27:e934292. doi: 10.12659/MSM.934292 - DOI - PMC - PubMed
    1. Peñuelas-Urquides K, González-Escalante L, Villarreal-Treviño L, Silva-Ramírez B, Gutiérrez-Fuentes DJ, Mojica-Espinosa R, et al.. Comparison of gene expression profiles between pansensitive and multidrug-resistant strains of Mycobacterium tuberculosis. Curr Microbiol. 2013;67(3):362–71. doi: 10.1007/s00284-013-0376-8 - DOI - PubMed
    1. González-Escalante L, Peñuelas-Urquides K, Said-Fernández S, Silva-Ramírez B, Bermúdez de León M. Differential expression of putative drug resistance genes in Mycobacterium tuberculosis clinical isolates. FEMS Microbiol Lett. 2015;362(23):fnv194. doi: 10.1093/femsle/fnv194 - DOI - PubMed
    1. Arriaga-Guerrero AL, Hernández-Luna CE, Rigal-Leal J, Robles-González RJ, González-Escalante LA, Silva-Ramírez B, et al.. LipF increases rifampicin and streptomycin sensitivity in a Mycobacterium tuberculosis surrogate. BMC Microbiol. 2020;20(1):132. doi: 10.1186/s12866-020-01802-x - DOI - PMC - PubMed

MeSH terms

LinkOut - more resources