. 2025 Apr;29(8):e70447.
doi: 10.1111/jcmm.70447.

Sphingosine-1-Phosphate Receptor 2 Agonist Mobilises Endogenous Muse Cells to Repair Damaged Myocardial Tissue in Male Rabbits

Affiliations

Sphingosine-1-Phosphate Receptor 2 Agonist Mobilises Endogenous Muse Cells to Repair Damaged Myocardial Tissue in Male Rabbits

Shingo Minatoguchi et al. J Cell Mol Med. 2025 Apr.

Abstract

Muse cells, pluripotent stem cells present mainly in the bone marrow (BM) selectively accumulate to damaged tissue by sensing sphingosine-1-phosphate (S1P) and replace damaged cells by differentiating in situ. Acute myocardial infarction (AMI) model rabbits were subcutaneously injected either with Vehicle (n = 15), S1PR2-agonist (n = 16), or S1PR2-agonist + S1PR2-antagonist (n = 10). The number of Muse cells in the peripheral blood was assessed by flow cytometry at 12 h after AMI. The S1PR2-agonist group showed a significant increase in the peripheral-blood Muse cell number at 12 h (p < 0.05), as well as infarct size reduction (p < 0.05) and improvement of left ventricular (LV) function (p < 0.05) at 2 weeks compared with the other 2 groups. The number of peripheral-blood Muse cells positively correlated with LV ejection fraction (p < 0.05) and inversely correlated with infarct size (p < 0.05). Transplanted autologous green fluorescent protein (GFP)-labelled BM-Muse cells into the BM, followed by the administration of either Vehicle (n = 5) or S1PR2 agonist (n = 5) revealed a higher number of homed GFP-Muse cells expressing the cardiac markers troponin-I, α-actinin, connexin-43 and the vascular marker CD31 in the border areas in the S1PR2-agonist group compared with the vehicle group. The mobilisation of endogenous Muse cells using S1PR2-agonist may be a promising therapeutic approach.

Keywords: cardiac function; endogenous muse cells; infarct size; mobilisation; myocardial infarction; sphingosine‐1‐phosphate receptor 2 agonist.


Conflict of interest statement

The authors declare no conflicts of interest.

Figures
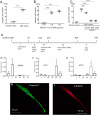
FIGURE 1
FIGURE 1
In vitro analysis of Muse cell migration and cardiac differentiation. (A–C) Migration assay of Muse cells. Migration of rabbit Muse cells toward rabbit AMI serum (A), S1PR2 agonist SID46371153 (B). Suppression of rabbit Muse cell migration toward rabbit AMI serum by the S1PR2 antagonist JTE‐013 (C). (D–I) Cardiac differentiation of rabbit peripheral‐blood Muse cells. (D) Protocol of cardiac differentiation. Stage I, suspension culture; Stage II, mesodermal induction; Stage III, BMP4 inhibition; Stage IV, cardiac‐endothelial progenitor induction by Wnt product inhibition; Stage V, cardiac‐lineage stabilisation. Reverse transcription‐quantitative polymerase chain reaction of GATA4 (E), cardiac troponin T (cTnT) (F) and sarcomeric α‐actinin (ACT2) from the Stage I to Stage V is shown. Expression of GATA4 was maximum at day 7, and cTnT and ACT2 were maximum at day 24 with statistical significance compared to day 1 (p < 0.05). (H and I): Immunostaining of rabbit peripheral‐blood Muse cells after cardiac differentiation (Stage V) expressing troponin T (H) and α‐actinin (I). (A) N = 5 in each bar, p < 0.001, unpaired Student's t‐test, (B and C) N = 5 in each bar, p < 0.01 and p < 0.001, 1‐way analysis of variance followed by multiple comparisons with the Dunnett method, (E–G) N = 5 in each bar of day 1, 7, 10, 17, 24 and 31, p < 0.05, 1‐way analysis of variance followed by multiple comparisons with the Dunnett method, *p < 0.05, **p < 0.01, ***p < 0.001.
FIGURE 2
FIGURE 2
Flow cytometry of the rabbit peripheral blood after S1PR2 agonist treatment. (A and B) Typical images of flow cytometry in the Vehicle (A) and S1PR2 agonist (B) groups. We gated the mononuclear cell area, and monocyte and lymphocyte areas on the basis of dot plot, one of the display types of FlowJo software (forward scatter [FSC] and side scatter [SSC] of the flow cytometer were focused on mononuclear cells; all cells). Distribution of SSEA‐3/CD44 double‐positive Muse cells in the mononuclear cell area, monocyte area, and lymphocyte area within the gated area (Muse cells). Percent of Muse cells in the monocyte and lymphocyte areas is indicated as the percent of Muse cells to that in the total mononuclear cell area. Number of Muse cells in the monocyte area was defined as the number of Muse cells in the peripheral blood because the majority of Muse cells were detected in the monocyte area and fewer Muse cells were detected in the lymphocyte area. (C) Number of SSEA‐3/CD44‐double‐positive Muse cells in the peripheral blood of the sham (n = 11), Vehicle (n = 15), S1PR2 agonist (n = 16), and S1PR2 agonist + antagonist (n = 10) groups. *p < 0.05, ***p < 0.001, 1‐way analysis of variance followed by multiple comparisons with the Tukey method. (D) Number of whole cells in the lymphocyte area in the sham (n = 11), Vehicle (n = 15), and S1PR2 agonist (n = 16) groups. No difference was detected amongst the 3 groups. 1‐way analysis of variance followed by multiple comparisons with the Tukey method. (E) Number of whole cells in the monocyte area in the sham (n = 11), Vehicle (n = 15), and S1PR2 agonist (n = 16) groups. No difference was detected amongst the 3 groups. 1‐way analysis of variance followed by multiple comparisons with the Tukey method, NS; not significant.
FIGURE 3
FIGURE 3
Physiologic analysis. Systolic blood pressure (SBP) (A), diastolic blood pressure (DBP) (B), heart rate (HR) (C), LV ejection fraction (LVEF) (D), LV fractional shortening (LVFS) (E), LV end‐diastolic diameter (LVDd) (H), and LV end‐systolic diameter (LVDs) (I) were assessed by echocardiography in the Vehicle, S1PR2 agonist, and S1PR2 agonist + antagonist groups. The peak +dP/dt (F) and peak −dP/dt (G) were assessed using a Millar catheter. (J) Relationship between the number of Muse cells in the peripheral blood after AMI and LV function. (A–I) Vehicle (n = 15), S1PR2 agonist group (n = 16), S1PR2 agonist + antagonist group (n = 10), *p < 0.05, ***p < 0.001: 1‐way analysis of variance followed by multiple comparisons with the Tukey method, (J) N = 31 (Vehicle and S1PR2 agonist groups), p < 0.05, linear regression analysis.
FIGURE 4
FIGURE 4
Myocardial infarct size and histologic analysis. (A) Plasma troponin T levels at 12 h after AMI in Vehicle, S1PR2 agonist and S1PR2 agonist + antagonist groups. (B) Typical figures of transverse LV sections at the papillary muscle level stained by Masson‐trichrome at 2 weeks. (C) The infarct size as a percent of the total LV area amongst the 3 groups at 2 weeks. Vehicle (n = 15), S1PR2 agonist group (n = 16), S1PR2 agonist + antagonist group (n = 10), p < 0.05, 1‐way analysis of variance followed by multiple comparisons with the Tukey method. (D) Relation between the number of Muse cells in the peripheral blood after AMI and the infarct size. n = 31 (Vehicle and S1PR2 agonist groups), p < 0.05, linear regression analysis. (E) TUNEL‐positive cardiomyocytes in the Vehicle (n = 5) and S1PR2 agonist (n = 5) groups at 3 days. Red signal: Cardiomyocytes stained by myoglobin, Green signal: Apoptotic cells detected by TUNEL, Blue signal: Counterstain by Hoechst 33342. 20 observations in each, p < 0.001, unpaired Student's t‐test. (F) CD31‐positive cells at the border area in the Vehicle (n = 5) and S1PR2 agonist (n = 5) groups at 2 weeks. 20 observations in each, p < 0.01, unpaired Student's t‐test. *p < 0.05, **p < 0.01, ***p < 0.001.
FIGURE 5
FIGURE 5
Cardiac marker expression in the vehicle and S1PR2 agonist groups at 14 days after AMI. (A) GFP‐positive Muse cells engrafted in the infarct and border areas of the myocardium in the Vehicle (n = 5) and S1PR2 agonist (n = 5) groups. (B) Number of GFP‐positive Muse cells engrafted in the infarct and border areas of the myocardium in the Vehicle and S1PR2 agonist groups (20 observations in each, p < 0.05, unpaired student's t‐test). (C–F) GFP‐positive Muse cells expressed troponin I and sarcomeric α‐actinin, markers of cardiomyocytes in the S1PR2 agonist (C and D) and Vehicle (E and F) groups. (G) GFP‐positive Muse cells expressed connexin 43, a marker of gap junction. (H) Number of GFP‐ and troponin I‐double‐positive cells, and GFP‐ and sarcomeric α‐actinin‐double‐positive cells in the Vehicle and S1PR2 agonist groups (20 observations in each, p < 0.05, unpaired student's t‐test). (I and J) GFP‐positive Muse cells expressed CD31, a marker of vascular endothelial cells, in the S1PR2 agonist (I) and Vehicle (J) groups. (K) Number of GFP‐ and CD31 double‐positive cells in the Vehicle and S1PR2 agonist groups. (20 observations in each, p < 0.05, unpaired student's t‐test) *p < 0.05, **p < 0.01, ***p < 0.001.

Similar articles

Cited by

References

    1. Pfeffer M. A. and Braunwald E., “Ventricular Remodeling After Myocardial Infarction. Experimental Observations and Clinical Implications,” Circulation 81 (1990): 1161–1172. - PubMed
    1. Aso S., Imamura H., Sekiguchi Y., et al., “Incidence and Mortality of Acute Myocardial Infarction. A Population‐Based Study Including Patients With Out‐Of‐Hospital Cardiac Arrest,” International Heart Journal 52 (2011): 197–202. - PubMed
    1. Yeh R. W., Sidney S., Chandra M., Sorel M., Selby J. V., and Go A. S., “Population Trends in the Incidence and Outcomes of Acute Myocardial Infarction,” New England Journal of Medicine 362 (2010): 2155–2165. - PubMed
    1. Chew D. S., Heikki H., Schmidt G., et al., “Change in Left Ventricular Ejection Fraction Following First Myocardial Infarction and Outcome,” JACC Clin Electrophysiol 4 (2018): 672–682. - PubMed
    1. Bolognese L., Neskovic A. N., Parodi G., et al., “Left Ventricular Remodeling After Primary Coronary Angioplasty: Patterns of Left Ventricular Dilation and Long‐Term Prognostic Implications,” Circulation 106 (2002): 2351–2357. - PubMed

MeSH terms