Factors Driving Pancreatic Cancer Survival Rates
- PMID: 40245290
- PMCID: PMC12175802
- DOI: 10.1097/MPA.0000000000002489
Factors Driving Pancreatic Cancer Survival Rates
Abstract
Objectives: To analyze trends driving the increase in the 5-year survival rate of pancreatic cancer over the last decade with a focus across disease stages.
Methods: Pancreatic cancer survival data was analyzed by disease stage, age, and race/ethnicity using the most recent data from the Surveillance, Epidemiology, and End Results (SEER) program. Stage distribution and survival rates were combined to evaluate the contribution of each stage to the overall survival rate.
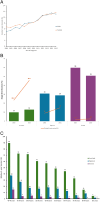
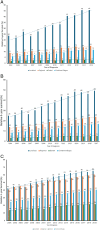
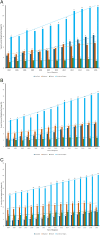
Results: The most recent SEER 17 data registry reports an overall 5-year survival rate for pancreatic cancer of 12%, with rates varying significantly across stages and age groups. The overall 5-year survival, irrespective of stage at the time of diagnosis, increased from 6% for patients diagnosed in 2004 to 12% for those diagnosed in 2015. During this same period, the incidence rate of distant disease decreased from 60% to 53%; however, the 5-year survival rate only increased from 2% to 3%, suggesting minimal advancements in treatment outcomes for individuals identified with distant disease at the time of diagnosis. In contrast, the 5-year survival rate for localized disease rose from 24% to 46%, while the stage distribution only slightly increased from 11% to 14% during the same period. Survival rates for distant disease at 4-, 3-, 2-year did not increase, however, the 1-year survival increased from 14% to 22% (2004-2019). These trends suggest progress in short-term outcomes, aligning with the availability of new FDA-approved treatments for advanced or metastatic disease with a median overall survival of <1 year.
Conclusions: This research confirms that the overall 5-year survival rate of 12% primarily reflects improved survival among those diagnosed with localized disease. Importantly, since only 14% of patients are diagnosed at this stage, the survival rate for most patients remains unchanged. This work also emphasizes the need for more research around variables that influence the overall 5-year survival rate, along with greater investment in early detection strategies to improve patient survival.
Keywords: SEER; pancreatic cancer; survival.
Copyright © 2025 The Author(s). Published by Wolters Kluwer Health, Inc.
Conflict of interest statement
The authors declare no conflict of interest.
Figures


References
-
- Siegel RL, Giaquinto AN, Jemal A. Cancer statistics, 2024. CA A Cancer J Clin. 2024;74:12–49. - PubMed
MeSH terms
LinkOut - more resources
Full Text Sources
Medical

