. 2025 May;133(5):57017.
doi: 10.1289/EHP15170. Epub 2025 May 23.

Effect Modification by Socioeconomic Status on the Associations between Early Placental Protein Damage and Exposure to Ambient Air PM2.5 Chemical Components

Affiliations

Effect Modification by Socioeconomic Status on the Associations between Early Placental Protein Damage and Exposure to Ambient Air PM2.5 Chemical Components

Junnan Yang et al. Environ Health Perspect. 2025 May.

Abstract

Background: Ambient fine particulate matter with aerodynamic diameter 2.5μm (PM2.5) exposure is associated with systemic protein damage in pregnant women. However, its effect on protein damage in human placentas is unclear.

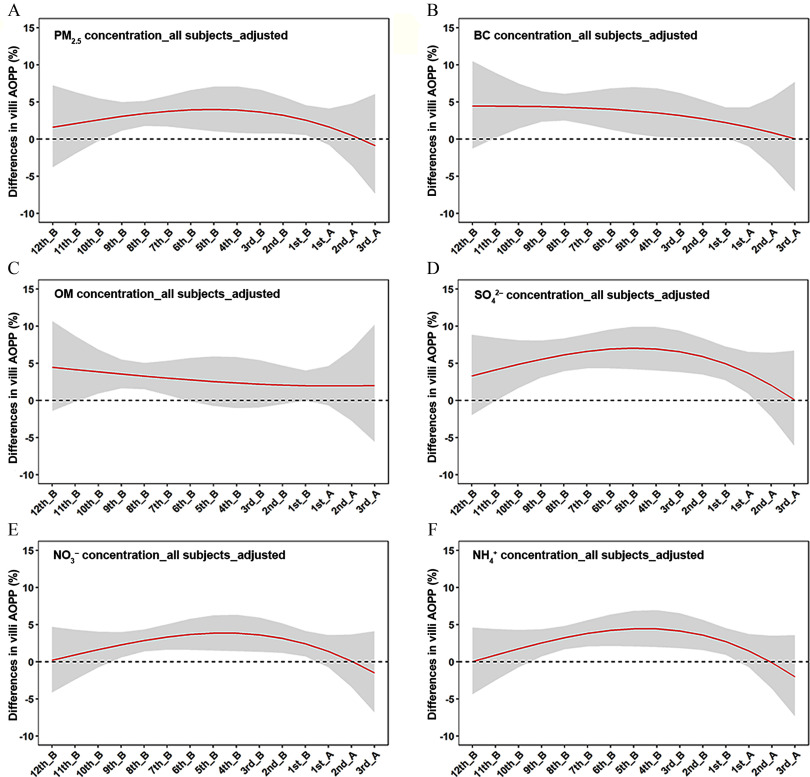
Objectives: We estimated the associations of PM2.5 and chemical component exposures with advanced oxidation protein products (AOPP) in placental villi tissues before 13 weeks of gestation.

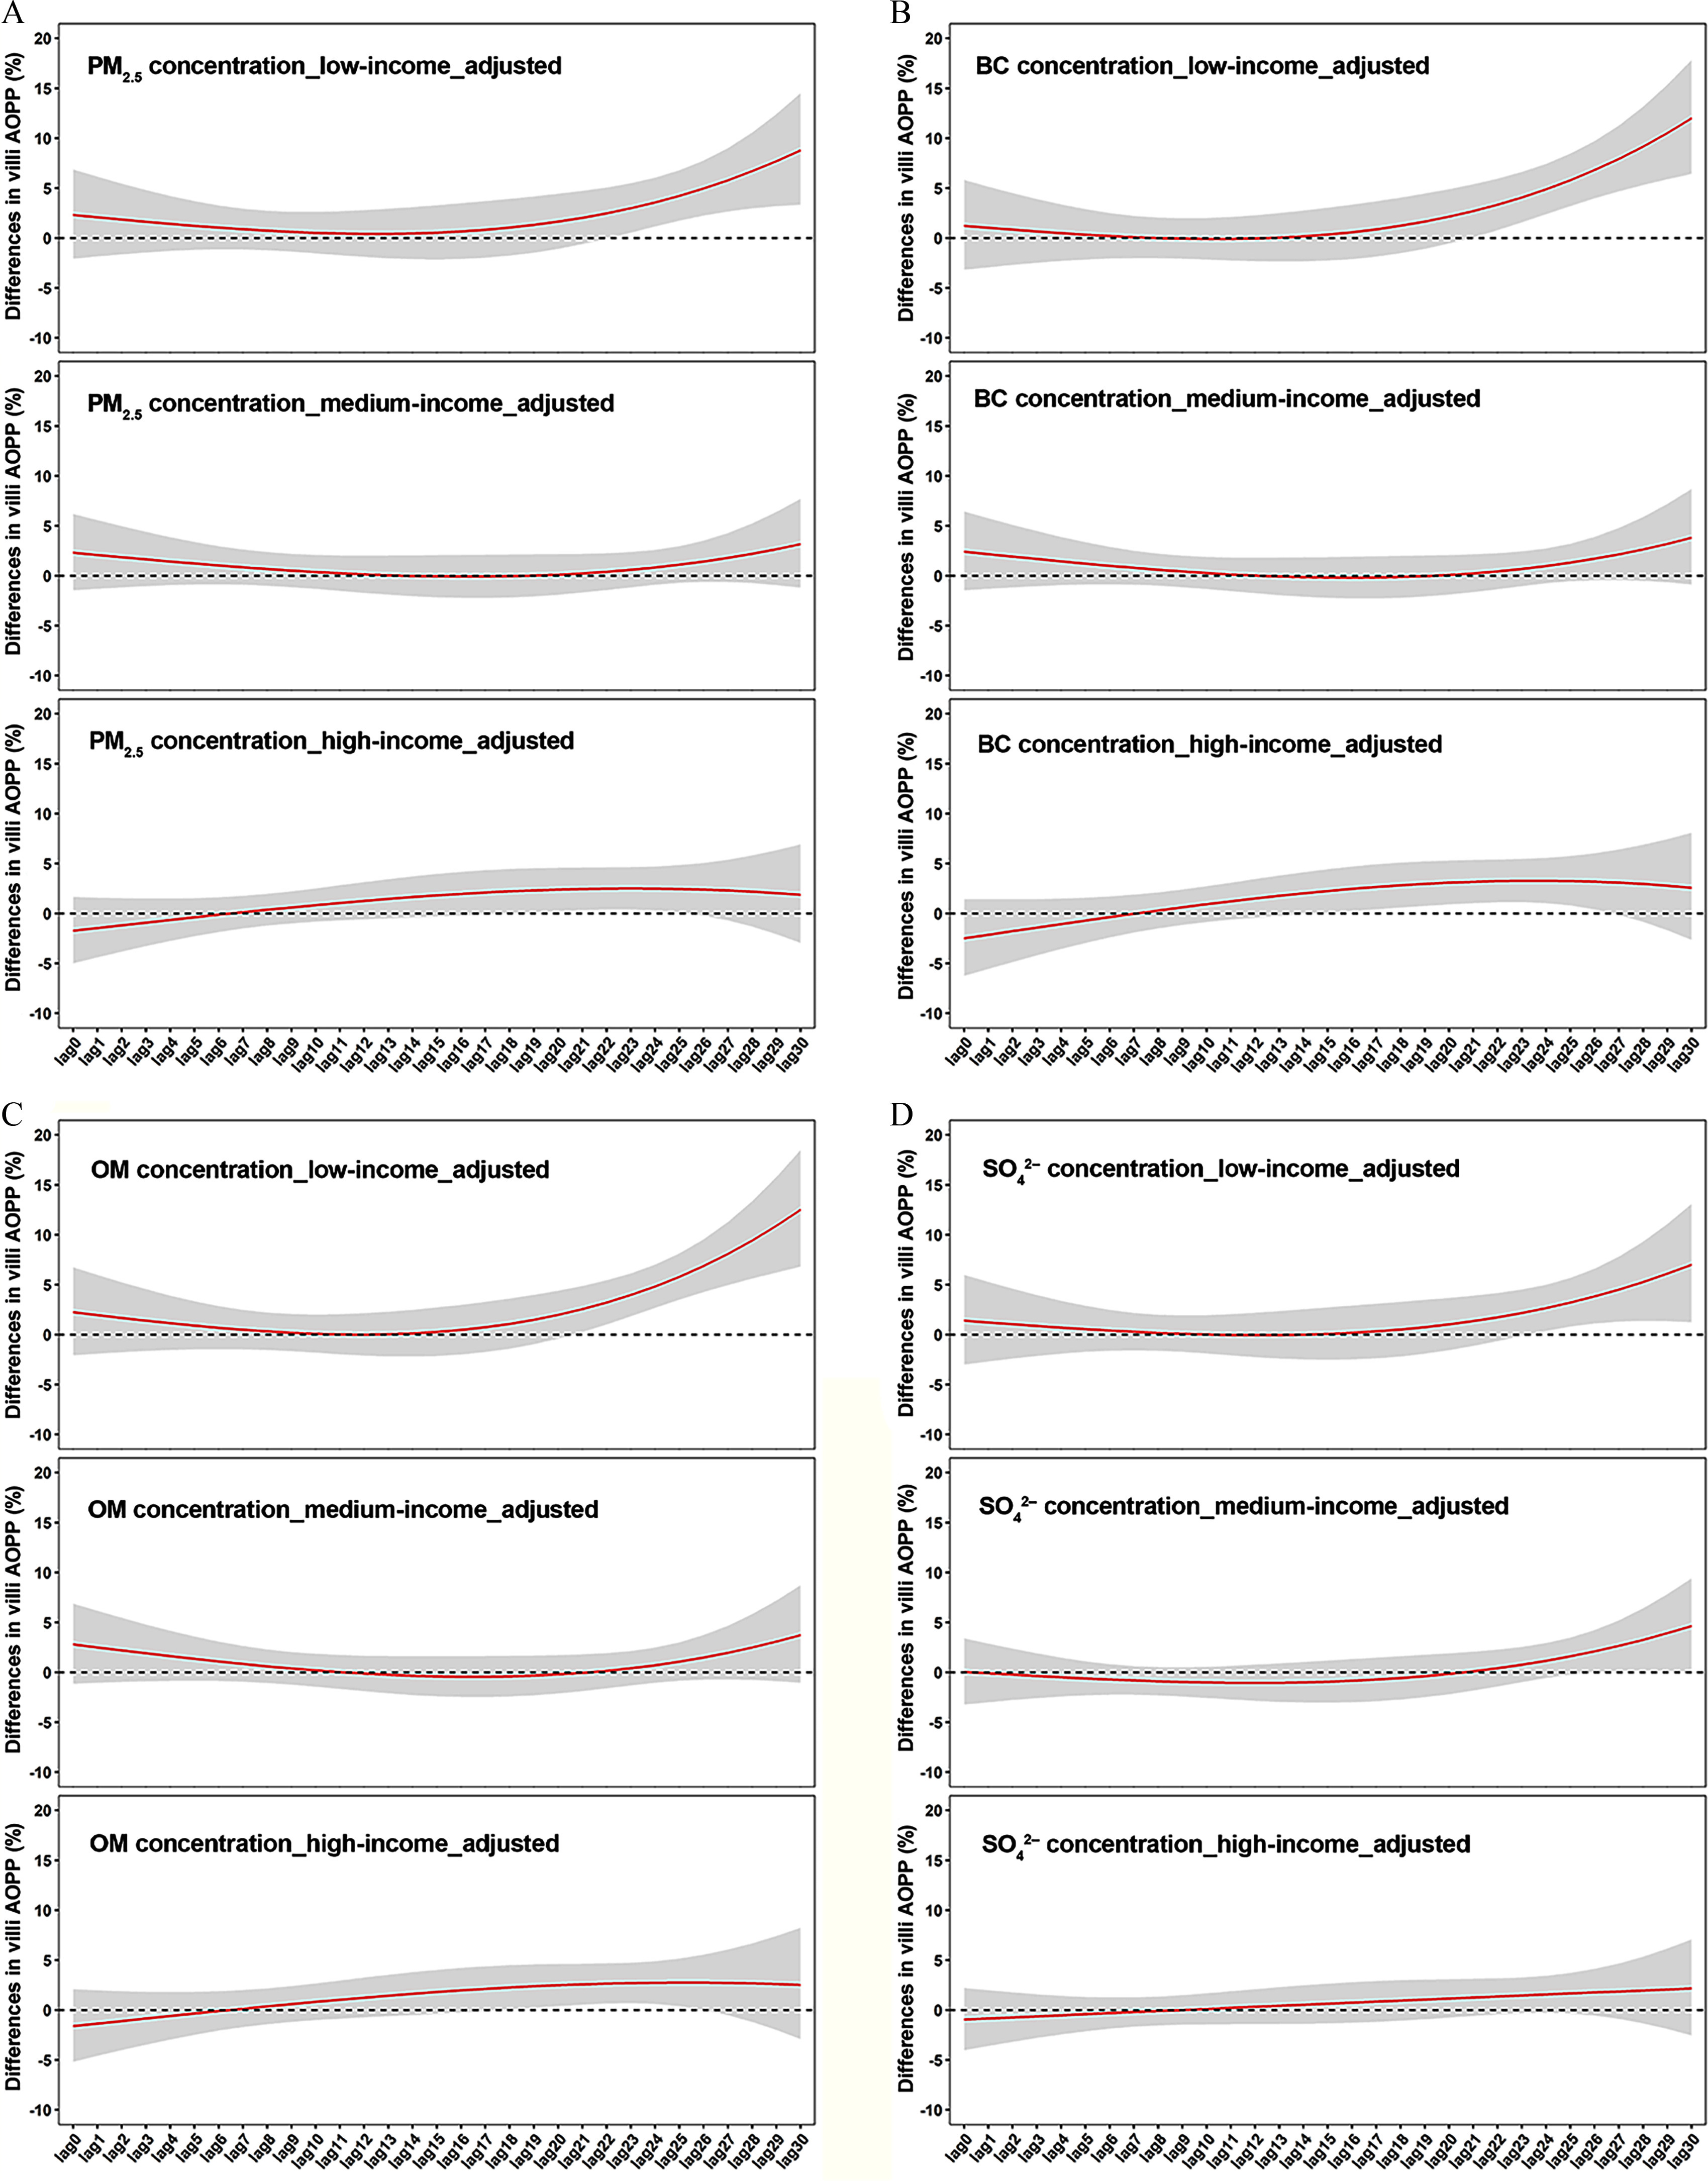
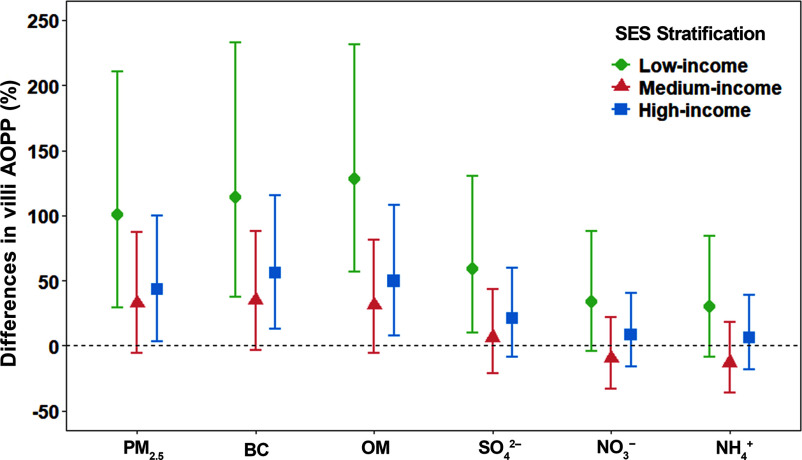
Methods: We enrolled 165 women with unintended normal early pregnancy (NEP) who requested induced abortion during the first trimester and 165 women with early pregnancy loss (EPL) who also requested induced abortion (2017-2022). Maternal daily PM2.5, black carbon (BC), organic matter (OM), sulfate, nitrate, and ammonium exposures from the 12th week before ovulation to villi collection were estimated using data accessed from the Tracking Air Pollution in China platform. Associations of pollutant exposures during the 30 days before villi collection, during the post-conception period (from ovulation to villi collection), and during the periovulatory period (from the 12th week before to the third week after ovulation) with villi AOPP were estimated and compared between the NEP and EPL groups. Additionally, effect modifications by socioeconomic status expressed in family monthly income per capita were estimated using stratified distributed lag nonlinear models.

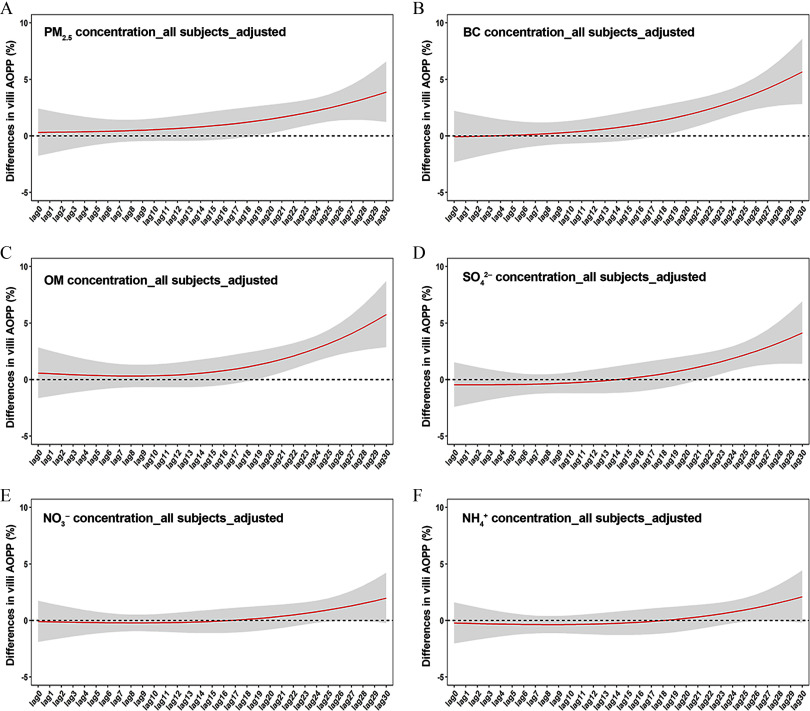
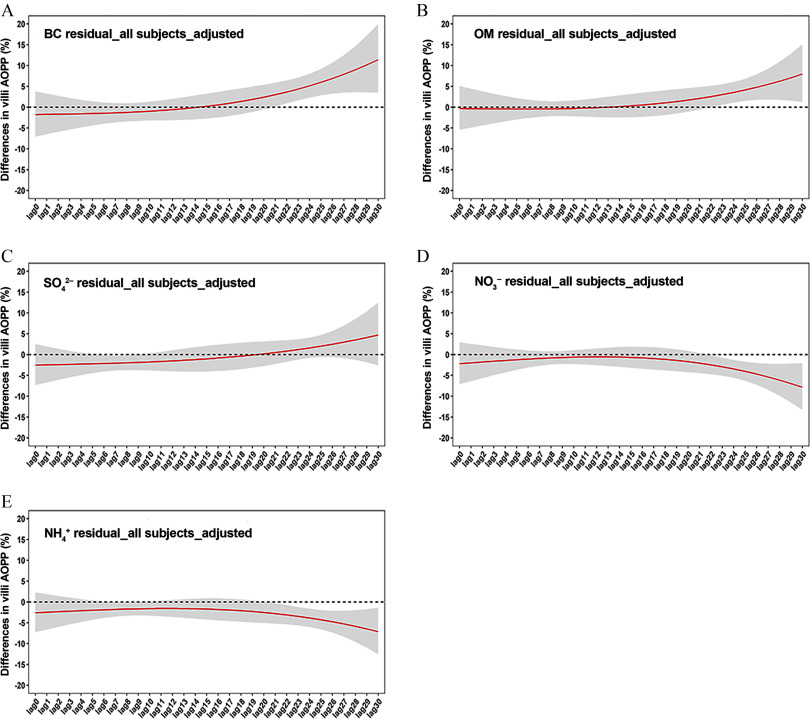
Results: Thirty-day cumulative and average post-conception exposures to higher concentrations of PM2.5, BC, and OM were associated with higher villi AOPP in all subjects and both groups. Thirty-day cumulative effects of per interquartile range increase in the residuals of BC and OM were robust in EPL [β values (95% confidence interval) of villi AOPP were 111.22% (17.96%, 278.24%) and 93.87% (20.63%, 211.56%)] but were not robust in NEP. The associations of per interquartile range increase in the concentrations of BC and OM at some lag days with higher villi AOPP were stronger in low-income stratification (the ranges of β values of villi AOPP were 10.51-11.99% and 8.08-12.50%) than those in medium-income stratification (3.19-3.80% and 1.95-3.73%) and high-income stratification (2.57-2.78% and 2.51-2.72%). Periovulatory OM exposure was positively associated with villi AOPP in EPL but not in NEP, and the susceptible periods to PM2.5 and the other four components were 1-4 weeks earlier in EPL than in NEP.

Discussion: Maternal PM2.5, BC, and OM exposures were positively associated with oxidative protein damage in early placenta. The associations were stronger in women with EPL or low-income. https://doi.org/10.1289/EHP15170.


Figures

Figures 1A to 1F are ribbon plots, plotting difference in villi advanced oxidation protein products (percentage), ranging from negative 5 to 10 in increments of 5 (y-axis) across lag 0 to lag 30 (x-axis) for particulate matter begin subscript 2.5 end subscript concentration all subjects adjusted, black carbon concentration all subjects adjusted, organic matter concentration all subjects adjusted, sulfate concentration all subjects adjusted, nitrate concentration all subjects adjusted, ammonium concentration all subjects adjusted.
Figure 1.
Daily distributed lag associations of per interquartile range increase in the concentrations of PM2.5 (A), BC (B), OM (C), SO42 (D), NO3 (E), and NH4+ (F) at lag 0–30 with differences in villi AOPP (%) in all subjects (n=330). Note: The IQRs of PM2.5, BC, OM, SO42, NO3, and NH4+ concentrations in the analyses were 33, 1.5, 8.1, 5.4, 7.7, and 4.7μg/m3, respectively. The independent variables in the distributed lag nonlinear models combined with multivariable linear regression models simultaneously included every daily exposure to PM2.5 or each component at lag 0–30, all demographic characteristics presented in Table 1, temperature, relative humidity, and group (EPL or NEP). Numeric data for Figure 1 can be found in Excel Table S1. AOPP, advanced oxidation protein product; BC, black carbon; EPL, early pregnancy loss; IQR, interquartile range; NEP, normal early pregnancy; NH4+, ammonium; NO3, nitrate; OM, organic matter; PM2.5, particulate matter with aerodynamic diameter 2.5μm; SO42, sulfate.
Figures 2A to 2E are ribbon plots, plotting difference in villi advanced oxidation protein products (percentage), ranging from negative 20 to 20 in increments of 5 (y-axis) across lag 0 to lag 30 (x-axis) for black carbon concentration all subjects adjusted, organic matter concentration all subjects adjusted, sulfate concentration all subjects adjusted, nitrate concentration all subjects adjusted, ammonium concentration all subjects adjusted.
Figure 2.
Daily distributed lag associations of per interquartile range in the residuals of BC (A), OM (B), SO42 (C), NO3 (D), and NH4+ (E) at lag 0–30 with differences in villi AOPP (%) in all subjects (n=330). Note: The IQRs of BC, OM, SO42, NO3, and NH4+ residuals were 0.19, 0.17, 0.49, 0.84, and 0.76, respectively. The independent variables in the distributed lag nonlinear models combined with multivariable linear regression models simultaneously included every daily residual of each chemical component at lag 0–30, all demographic characteristics presented in Table 1, temperature, relative humidity, and group (EPL or NEP). Numeric data for Figure 2 can be found in Excel Table S2. AOPP, advanced oxidation protein product; BC, black carbon; EPL, early pregnancy loss; IQR, interquartile range; NEP, normal early pregnancy; NH4+, ammonium; NO3, nitrate; OM, organic matter; PM2.5, particulate matter with aerodynamic diameter 2.5μm; SO42, sulfate.
Figure 3A is a set of three ribbon plots, plotting difference in villi advanced oxidation protein products (percentage), ranging from negative 10 to 20 in increments of 5 (y-axis) across lag 0 to lag 30 (x-axis) for particulate matter begin subscript 2.5 end subscript concentration low income adjusted, particulate matter begin subscript 2.5 end subscript concentration medium income adjusted, and particulate matter begin subscript 2.5 end subscript concentration high income adjusted. Figure 3B is a set of three ribbon plots, plotting difference in villi advanced oxidation protein products (percentage), ranging from negative 10 to 20 in increments of 5 (y-axis) across lag 0 to lag 30 (x-axis) for black carbon concentration low income adjusted, black carbon concentration medium income adjusted, and black carbon concentration high income adjusted. Figure 3C is a set of three ribbon plots, plotting difference in villi advanced oxidation protein products (percentage), ranging from negative 10 to 20 in increments of 5 (y-axis) across lag 0 to lag 30 (x-axis) for organic matter concentration low income adjusted, organic matter concentration medium income adjusted, and organic matter concentration high income adjusted. Figure 3D is a set of three ribbon plots, plotting difference in villi advanced oxidation protein products (percentage), ranging from negative 10 to 20 in increments of 5 (y-axis) across lag 0 to lag 30 (x-axis) for sulfate concentration low income adjusted, sulfate concentration medium income adjusted, and sulfate concentration high income adjusted.
Figure 3.
Daily distributed lag associations of per interquartile range increase in the concentrations of PM2.5 (A), BC (B), OM (C), and SO42 (D) at lag 0–30 with differences in villi AOPP (%) in stratifications of low income (n=84), medium income (n=111), and high income (n=135). Note: The IQRs of PM2.5, BC, OM, and SO42 concentrations in the analyses were 33, 1.5, 8.1, and 5.4μg/m3, respectively. The independent variables in the distributed lag nonlinear models combined with multivariable linear regression models simultaneously included every daily exposure to PM2.5, BC, OM, or SO42 at lag 0–30, all demographic characteristics presented in Table 1, temperature, relative humidity, and group (EPL or NEP). Numeric data for Figure 3 can be found in Excel Table S3. AOPP, advanced oxidation protein product; BC, black carbon; EPL, early pregnancy loss; IQR, interquartile range; NEP, normal early pregnancy; OM, organic matter; PM2.5, particulate matter with aerodynamic diameter 2.5μm; SO42, sulfate.
Figure 4 is an error bar graph, plotting difference in villi advanced oxidation protein products (percentage), ranging from negative 50 to 250 in increments of 50 (y-axis) across particulate matter begin subscript 2.5 end subscript, black carbon, organic matter, sulfate, nitrate, and ammonium (x-axis) for socioeconomic status stratification, including low income, medium income, and high income.
Figure 4.
Thirty-day cumulative associations of per interquartile range increase in the concentrations of PM2.5 and chemical components with differences in villi AOPP (%) in stratifications of low income (n=84), medium income (n=111), and high income (n=135). Note: The IQRs of PM2.5, BC, OM, SO42, NO3, and NH4+ concentrations in the analyses were 33, 1.5, 8.1, 5.4, 7.7, and 4.7μg/m3, respectively. The independent variables in the distributed lag nonlinear models combined with multivariable linear regression models simultaneously included every daily exposure to PM2.5 or each component at lag 0–30, all demographic characteristics presented in Table 1, temperature, relative humidity, and group (EPL or NEP). Numeric data for Figure 4 can be found in Table S4. AOPP, advanced oxidation protein product; BC, black carbon; EPL, early pregnancy loss; IQR, interquartile range; NEP, normal early pregnancy; NH4+, ammonium; NO3, nitrate; OM, organic matter; PM2.5, particulate matter with aerodynamic diameter 2.5μm; SES, socioeconomic status; SO42, sulfate.
Figures 5A and 5B are error bar graphs, plotting difference in villi advanced oxidation protein products (percentage), ranging from negative 40 to 200 in increments of 40 and negative 50 to 450 in increments of 50 (y-axis) across all subjects, early pregnancy loss, and normal early pregnancy (x-axis) for pollutant concentration, including particulate matter begin subscript 2.5 end subscript, black carbon, organic matter, sulfate, nitrate, and ammonium; and component residual, including black carbon, organic matter, sulfate, nitrate, and ammonium.
Figure 5.
Associations of per interquartile range increase in the concentrations (A) and residuals (B) of average PM2.5 and chemical components during the post-conception period (from ovulation to villi collection) with differences in villi AOPP (%) in all subjects (n=330), EPL (n=165), and NEP (n=165). Note: The IQRs of PM2.5, BC, OM, SO42, NO3, and NH4+ concentrations in the analyses were 33, 1.5, 8.1, 5.4, 7.7, and 4.7μg/m3, respectively. The IQRs of BC, OM, SO42, NO3, and NH4+ residuals were 0.19, 0.17, 0.49, 0.84, and 0.76, respectively. The independent variables in the multivariable linear regression models included average concentration of PM2.5 or each component during the postconception period in panel A, replaced by residual of each component during the postconception period in panel B, and also included all demographic characteristics presented in Table 1, temperature, relative humidity, and group (EPL or NEP). Numeric data for Figure 5 can be found in Table S6. AOPP, advanced oxidation protein product; BC, black carbon; EPL, early pregnancy loss; IQR, interquartile range; NEP, normal early pregnancy; NH4+, ammonium; NO3, nitrate; OM, organic matter; PM2.5, particulate matter with aerodynamic diameter 2.5μm; SO42, sulfate.
Figures 6A to 6F are ribbon plots, plotting difference in villi advanced oxidation protein products (percentage), ranging from negative 10 to 15 in increments of 5 (y-axis) across twelfth week before ovulation, eleventh week before ovulation, tenth week before ovulation, ninth week before ovulation, eighth week before ovulation, seventh week before ovulation, sixth week before ovulation, fifth week before ovulation, fourth week before ovulation, third week before ovulation, second week before ovulation, first week before ovulation, first week after ovulation, second week after ovulation, and third week after ovulation (x-axis) for particulate matter begin subscript 2.5 end subscript concentration all subjects adjusted, black carbon concentration all subjects adjusted, organic matter concentration all subjects adjusted, sulfate concentration all subjects adjusted, nitrate concentration all subjects adjusted, and ammonium concentration all subjects adjusted.
Figure 6.
Weekly distributed lag associations of per interquartile range increase in the concentrations of PM2.5 (A), BC (B), OM (C), SO42 (D), NO3 (E), and NH4+ (F) during the periovulatory period with differences in villi AOPP (%) in all subjects (n=330). Note: The IQRs of PM2.5, BC, OM, SO42, NO3, and NH4+ concentrations in the analyses were 33, 1.5, 8.1, 5.4, 7.7, and 4.7μg/m3, respectively. The independent variables in the distributed lag nonlinear models combined with multivariable linear regression models simultaneously included 15 weekly PM2.5 or each component concentrations, all demographic characteristics presented in Table 1, and group (EPL or NEP). Numeric data for Figure 6 can be found in Excel Tables S4. _A, week after ovulation; _B, week before ovulation; AOPP, advanced oxidation protein product; BC, black carbon; EPL, early pregnancy loss; IQR, interquartile range; NEP, normal early pregnancy; NH4+, ammonium; NO3, nitrate; OM, organic matter; PM2.5, particulate matter with aerodynamic diameter 2.5μm; SO42, sulfate.

Similar articles

References

    1. Macchi C, Sirtori CR, Corsini A, Mannuccio Mannucci P, Ruscica M. 2023. Pollution from fine particulate matter and atherosclerosis: a narrative review. Environ Int 175:107923, PMID: 37119653, 10.1016/j.envint.2023.107923. - DOI - PubMed
    1. Sierra-Vargas MP, Montero-Vargas JM, Debray-García Y, Vizuet-de-Rueda JC, Loaeza-Román A, Terán LM. 2023. Oxidative stress and air pollution: its impact on chronic respiratory diseases. Int J Mol Sci 24(1):853, PMID: 36614301, 10.3390/ijms24010853. - DOI - PMC - PubMed
    1. Yu Y, Sun Q, Li T, Ren X, Lin L, Sun M, et al. . 2022. Adverse outcome pathway of fine particulate matter leading to increased cardiovascular morbidity and mortality: an integrated perspective from toxicology and epidemiology. J Hazard Mater 430:128368, PMID: 35149491, 10.1016/j.jhazmat.2022.128368. - DOI - PubMed
    1. Li S, Li L, Zhang C, Fu H, Yu S, Zhou M, et al. . 2023. PM2.5 leads to adverse pregnancy outcomes by inducing trophoblast oxidative stress and mitochondrial apoptosis via KLF9/CYP1A1 transcriptional axis. eLife 12:e85944, PMID: 37737576, 10.7554/eLife.85944. - DOI - PMC - PubMed
    1. Wang L, Luo D, Liu X, Zhu J, Wang F, Li B, et al. . 2021. Effects of PM2.5 exposure on reproductive system and its mechanisms. Chemosphere 264(pt 1):128436, PMID: 33032215, 10.1016/j.chemosphere.2020.128436. - DOI - PubMed

LinkOut - more resources