

Transcriptome analysis reveals the alleviating effect of Polysaccharide of Atractylodes macrocephala Koidz on thymic involution in Magang geese
- PMID: 40245540
- PMCID: PMC12032336
- DOI: 10.1016/j.psj.2025.105155
Transcriptome analysis reveals the alleviating effect of Polysaccharide of Atractylodes macrocephala Koidz on thymic involution in Magang geese
Abstract
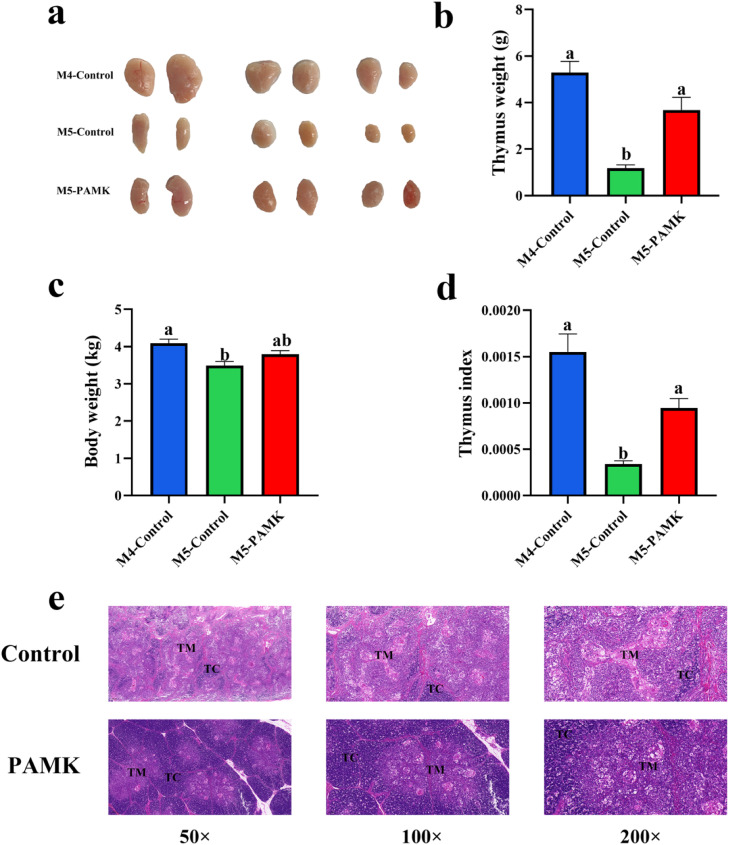
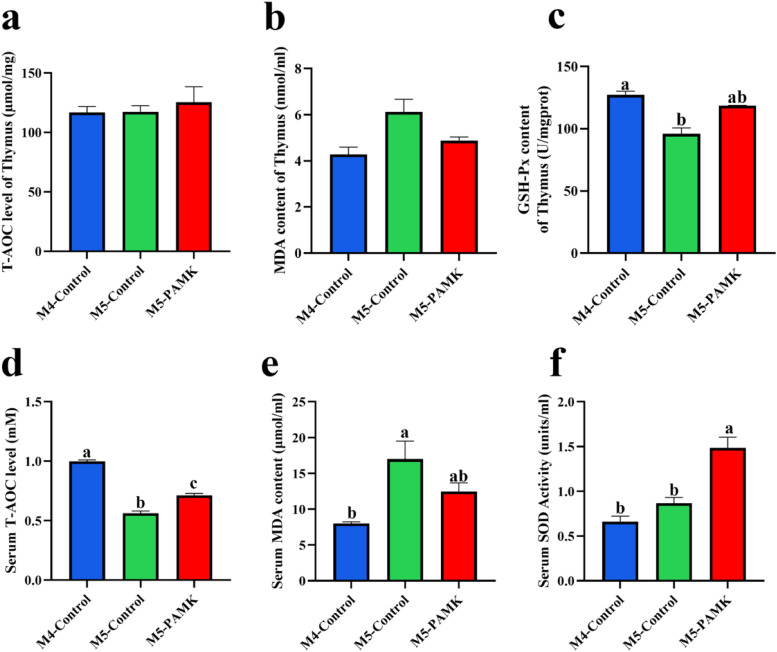
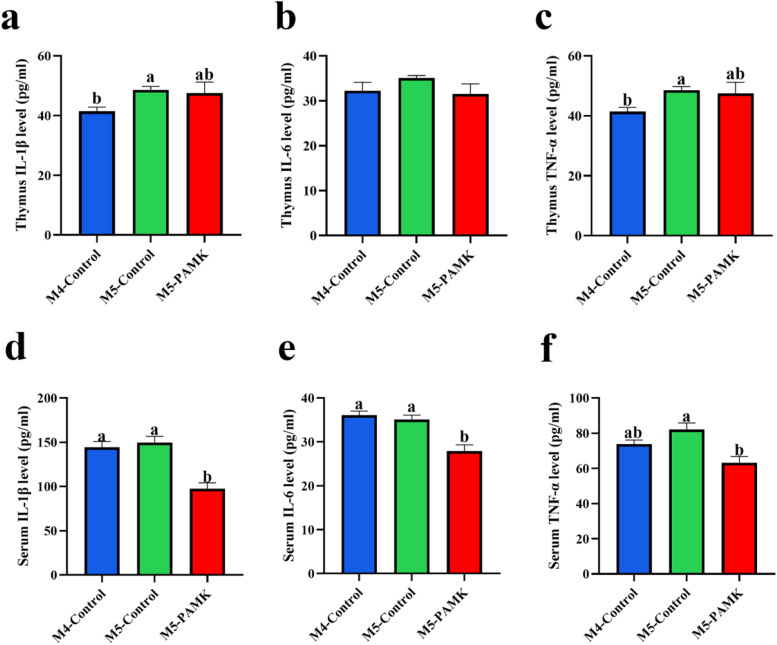
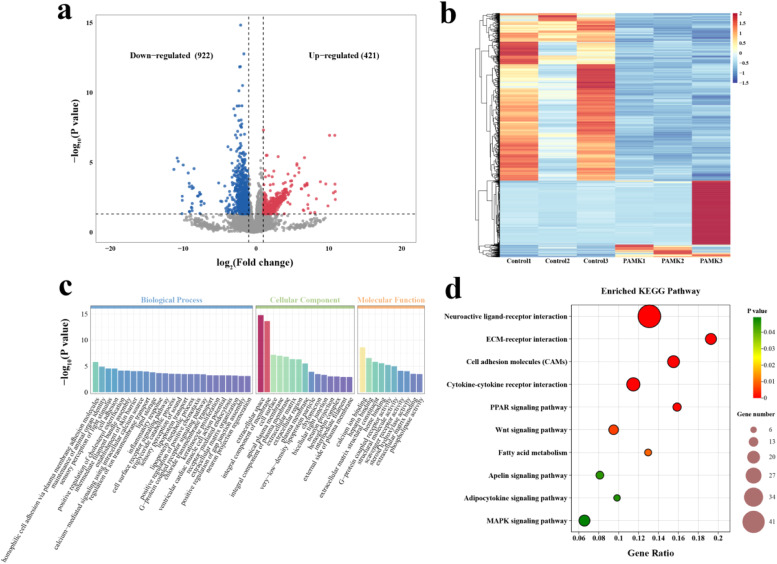
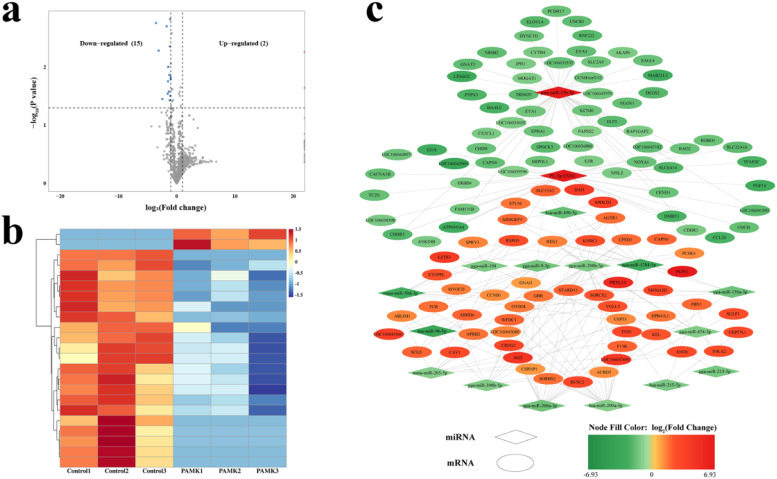
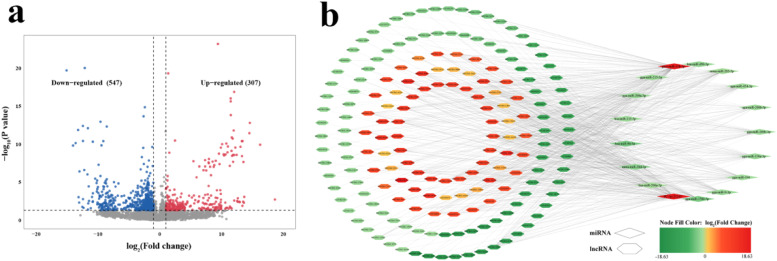
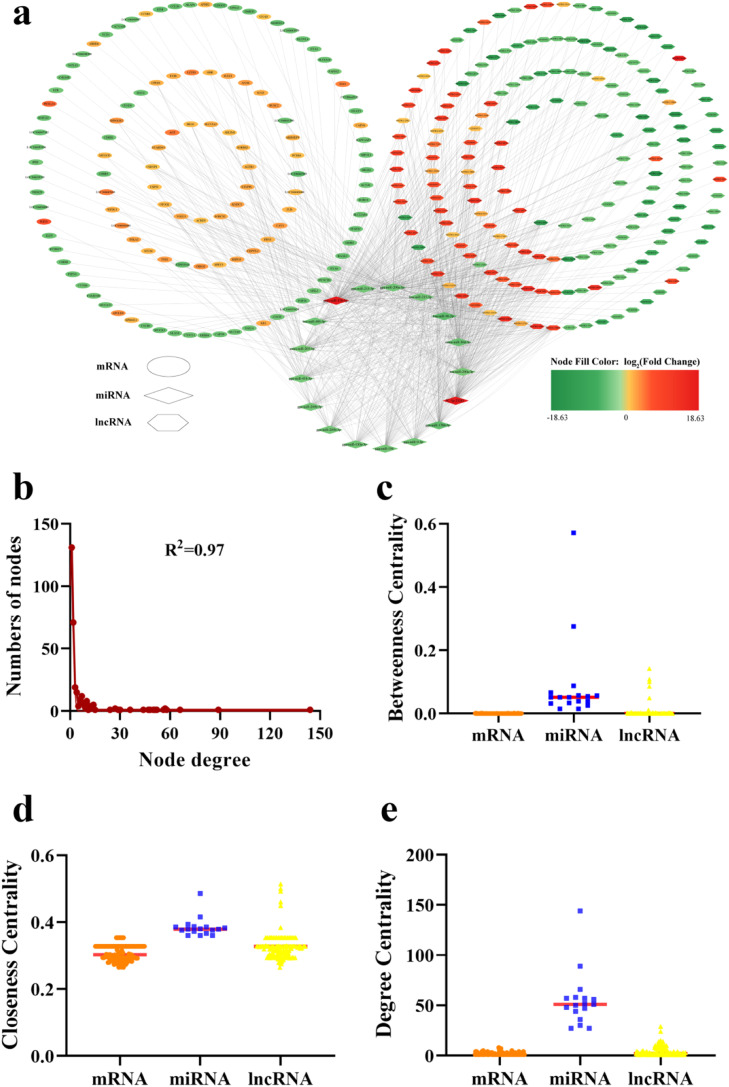
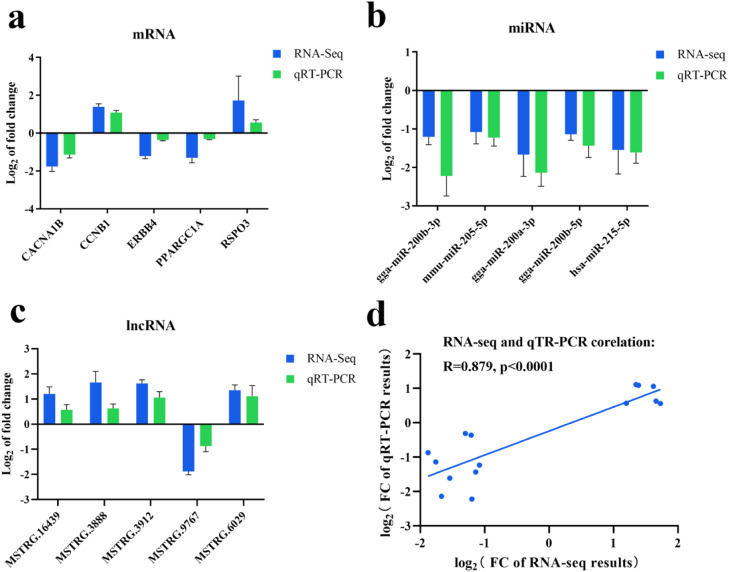
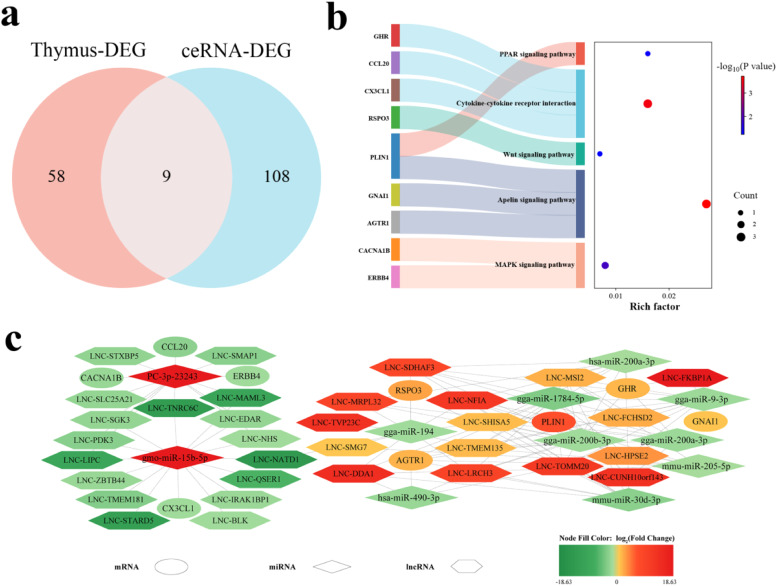
Thymic involution is one of the important causes of decreased immunity in the body. Noncoding RNAs (miRNAs and lncRNAs) play crucial roles in regulating organ growth and development. Polysaccharide of Atractylodes macrocephala Koidz (PAMK) is widely acknowledged for its anti-oxidant, anti-aging, and immune-enhancing effects. However, its potential application in preventing the age-related thymic involution of Magang geese has not been previously reported. In this study, 54 4-month-old Magang geese were randomly divided into 3 groups, the thymus and serum of 18 geese were collected aseptically after 3 days of prefeeding period, and the remaining geese were randomly divided into control and PAMK groups (3 replicates per group and 6 Magang geese per replicate). Geese in the control group were fed a basal diet, and geese in the PAMK group were fed a basal diet supplemented with 400 mg/kg PAMK. The thymus and serum were collected 1 month later. The results of thymus index measurement showed that PAMK could alleviate thymus index. Furthermore, compared with the M5-Control group, HE staining showed that PAMK made the proportion of thymus medulla increased, and the boundary between cortex and medulla was clearer. Antioxidant function and cytokine content detection showed that, compared with the M5-Control group, PAMK increased T-AOC and GSH-Px levels in thymus, increased T-AOC level and SOD activity in serum, decreased MDA content in thymus and serum, and decreased IL-1β, IL-6 and TNF-α levels. To further explore the mechanism, 3 samples from the control and PAMK groups were selected for RNA-Seq. Through transcriptome analysis and prediction, a triple regulatory ceRNA network of 9 mRNAs, 11 miRNAs and 32 lncRNAs associated with alleviating thymic involution was constructed. Moreover, these genes were respectively enriched in the PPAR, Cytokine-cytokine receptor interaction, WNT, Apelin and MAPK signaling pathways. In summary, PAMK may alleviate age-related thymic involution in Magang geese by alleviating the thymus index, increasing the antioxidant level and regulating the cytokine content, potentially via the PPAR, Cytokine-cytokine receptor interaction, WNT, Apelin, and MAPK signaling pathways.
Keywords: Goose; Polysaccharides of Atractylodes macrocephala Koidz; Thymic involution; Transcriptome analysis.
Copyright © 2025. Published by Elsevier Inc.
Conflict of interest statement
Disclosures The authors declare that the research was conducted in the absence of any commercial or financial relationships that could be construed as a potential conflict of interest.
Figures
Similar articles
-
Polysaccharides of Atractylodes macrocephala Koidz alleviate bursa of Fabricius involution in Magang geese by inhibiting the Wnt signaling pathway.Poult Sci. 2025 Jul;104(7):105227. doi: 10.1016/j.psj.2025.105227. Epub 2025 May 1. Poult Sci. 2025. PMID: 40339240 Free PMC article.
-
Polysaccharide of Atractylodes macrocephala Koidz alleviate lipopolysaccharide-stimulated liver inflammation injury of goslings through miR-223/NLRP3 axis.Poult Sci. 2023 Jan;102(1):102285. doi: 10.1016/j.psj.2022.102285. Epub 2022 Oct 23. Poult Sci. 2023. PMID: 36436369 Free PMC article.
-
Polysaccharide of Atractylodes macrocephala Koidz alleviate lipopolysaccharide-induced liver injury in goslings via the p53 and FOXO pathways.Poult Sci. 2023 Mar;102(3):102480. doi: 10.1016/j.psj.2023.102480. Epub 2023 Jan 6. Poult Sci. 2023. PMID: 36680857 Free PMC article.
-
*The traditional Chinese medicine processing change chemical composition and pharmacological effectiveness: Taking Atractylodes macrocephala Koidz. and honey bran-fried Atractylodes macrocephala Koidz. as examples.Phytomedicine. 2024 Jul 25;130:155739. doi: 10.1016/j.phymed.2024.155739. Epub 2024 May 15. Phytomedicine. 2024. PMID: 38797027 Review.
-
Role of thymus in health and disease.Int Rev Immunol. 2023;42(5):347-363. doi: 10.1080/08830185.2022.2064461. Epub 2022 May 20. Int Rev Immunol. 2023. PMID: 35593192 Review.
References
MeSH terms
Substances
LinkOut - more resources
Full Text Sources
