. 2025 Apr 17;16(1):3653.
doi: 10.1038/s41467-025-58748-9.

Hypoxia-induced Wnt5a-secreting fibroblasts promote colon cancer progression

Affiliations

Hypoxia-induced Wnt5a-secreting fibroblasts promote colon cancer progression

Akikazu Harada et al. Nat Commun. .

Abstract

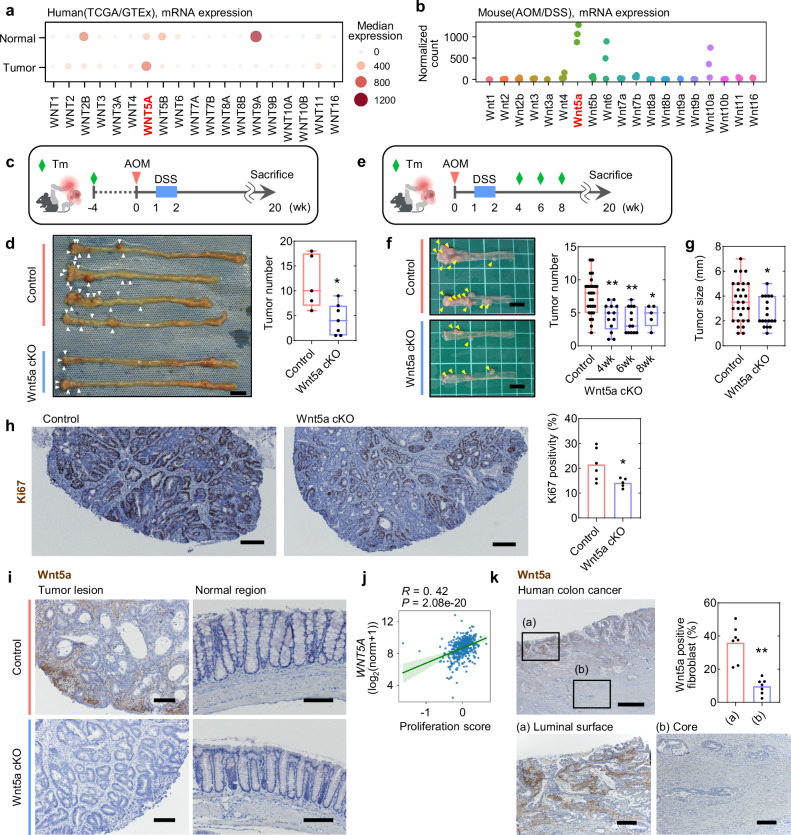
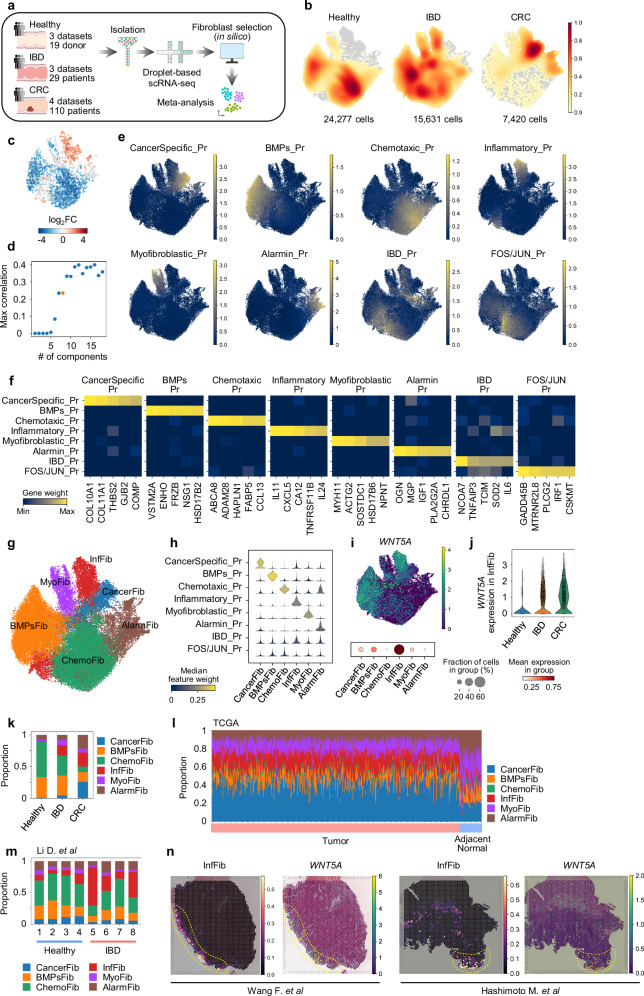
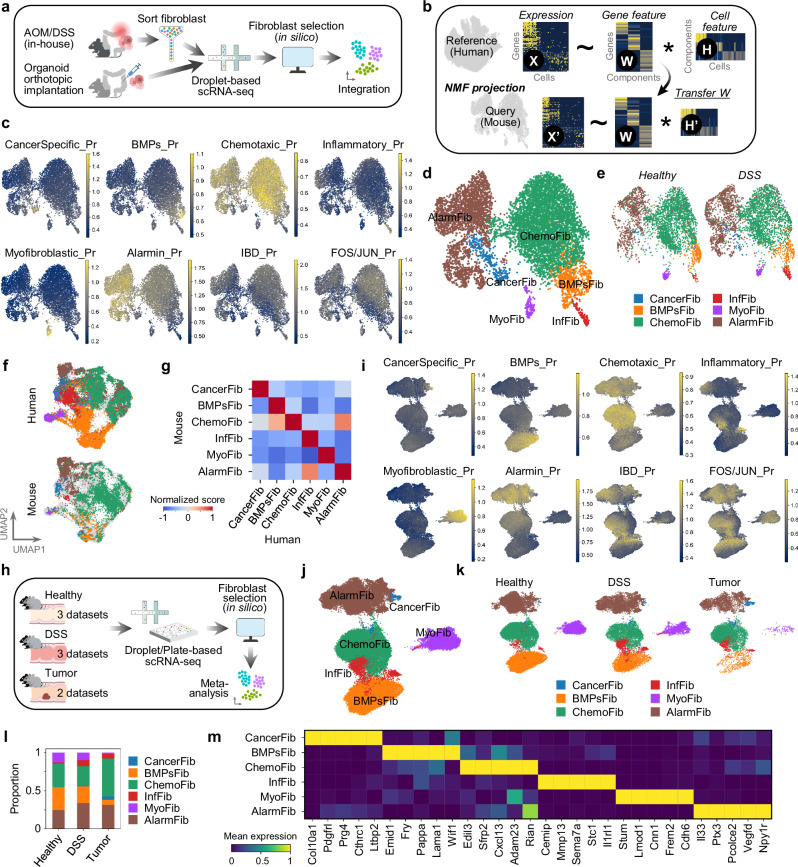
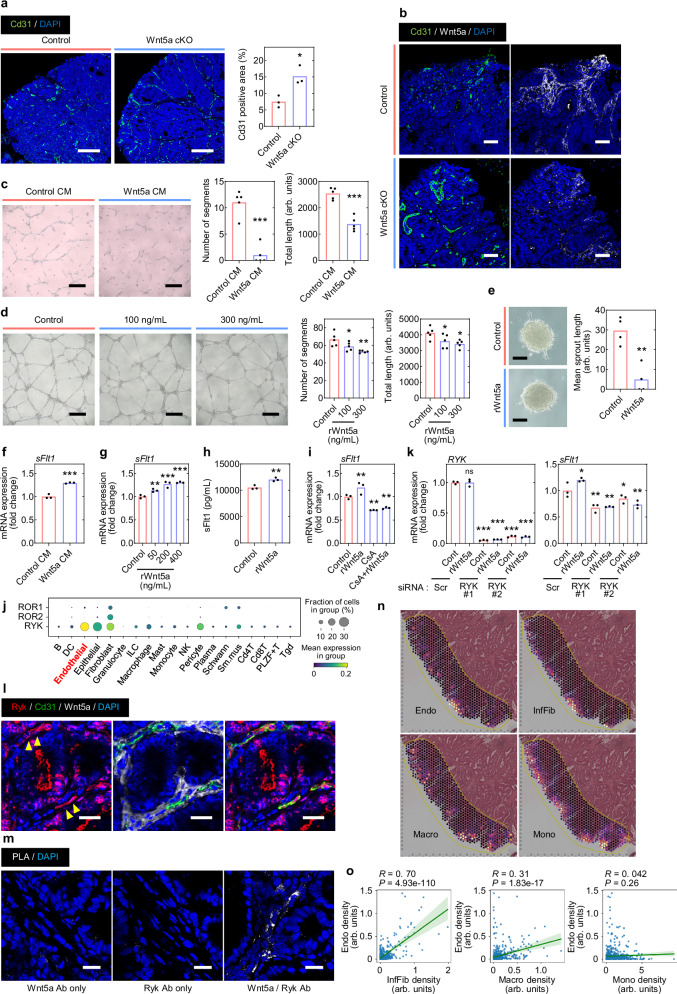
Wnt5a, a representative Wnt ligand that activates the β-catenin-independent pathway, has been shown to promote tumorigenesis. However, it is unclear where Wnt5a is produced and how it affects colon cancer aggressiveness. In this study, we demonstrate that Wnt5a is expressed in fibroblasts near the luminal side of the tumor, and its depletion suppresses mouse colon cancer formation. To characterize the specific fibroblast subtype, a meta-analysis of human and mouse colon fibroblast single-cell RNA-seq data is performed. The results show that Wnt5a is expressed in hypoxia-induced inflammatory fibroblast (InfFib), accompanied by the activation of HIF2. Moreover, Wnt5a maintains InfFib through the suppression of angiogenesis mediated by soluble VEGF receptor1 (Flt1) secretion from endothelial cells, thereby inducing further hypoxia. InfFib also produces epiregulin, which promotes colon cancer growth. Here, we show that Wnt5a acts on endothelial cells, inducing a hypoxic environment that maintains InfFib, thereby contributing to colon cancer progression through InfFib.


Conflict of interest statement

Competing interests: The authors declare no competing interests.

Figures

Fig. 1
Fig. 1. Tumor promotive effect of Wnt5a in colon cancer.
a Expression profiles of 19 Wnt ligands in colon adenocarcinoma and normal colon from the TcgaTargetGtex dataset (adenocarcinoma, n = 288; normal, n = 308). Normalized count data are presented as a dot plot, and the color and size of dots represent the median level of each gene. b Expression profiles of 19 Wnt ligands obtained from bulk RNA-seq of mouse AOM/DSS tumors (n = 3 different tumors from 2 mice). Normalized count data are presented as a strip plot. c Experimental schedule of the AOM/DSS model. Tamoxifen was administered 4 weeks before the AOM treatment. Tm, tamoxifen. d (Left) Representative macroscopic images of tumors in colon from Wnt5afl/fl (control, n = 5) and Wnt5afl/fl;CAG-Cre/ERT2Tg (Wnt5a cKO, n = 7) mice induced by the experimental design shown in (c). (Right) The total number of tumors were counted, and the results are shown by a box plot. Scale bar, 10 mm. (Unpaired t-test, Two-tailed). e Experimental schedule of the AOM/DSS model. Tamoxifen was administered 4, 6, or 8 weeks after the AOM treatment. Tm, tamoxifen. f (Left) Representative macroscopic images of tumors in the colon from control and Wnt5a cKO mice treated with tamoxifen 6 weeks after the AOM treatment. (Right) The total number of tumors for each time period in which tamoxifen was administered (control, n = 27; 4wk, n = 13; 6wk, n = 13; 8wk, n = 5) were counted, and the results are shown by a box plot. Scale bars, 10 mm. (One-way ANOVA, Holm-Sidak’s multiple comparisons test). g The diameter of tumors from control (n = 28) and Wnt5a cKO (n = 18) mice treated with tamoxifen 6 weeks after the AOM treatment were measured, and the results are shown by a box plot. (Unpaired t-test, Two-tailed). h Tissue sections from control (n = 6 different tumors from 6 mice) or Wnt5a cKO (n = 5 different tumors from 3 mice)-derived tumors were stained with anti-Ki67 antibody and counterstained with hematoxylin, and the Ki67-positive cells were counted. The results are shown as the percentage of positively stained cells compared to the total number of cells and presented as a bar plot. Scale bars, 100 μm. (Unpaired t-test, Two-tailed). i Tissue sections from control and Wnt5a cKO-derived tumors or colonic mucosa from non-cancerous mice were stained with anti-Wnt5a antibody and counterstained with hematoxylin. Scale bars, 40 μm. j A scatter plot showing the correlation between signature scores of proliferation (x-axis) and WNT5A gene expression levels (y-axis) was obtained from TCGA-COAD patient dataset. A regression line was fitted using linear regression, and the shaded area represents the 95% confidence interval. The Spearman R- and P-values are shown on the top. k Tissue sections from human colon cancer specimens (n = 7) were stained with anti-Wnt5a antibody and counterstained with hematoxylin, and the proportion of Wnt5a-positive fibroblasts was calculated in the luminal surface and the core region. The core region was defined as the area located more than 1 mm away from the luminal surface toward the tumor center, while the area closer to the luminal surface than the core region was defined as the luminal surface region. The regions in the black solid squares in the upper panel are shown enlarged in the lower panels. The percentage of Wnt5a positive fibroblasts compared to the total fibroblasts is presented as a bar plot. Scale bars, (upper) 1 mm, (lower) 200 μm. (Unpaired t-test, Two-tailed). dfg In box and whiskers plots, the top and bottom horizontal lines represent the 75th and the 25th percentiles, respectively, and the middle horizontal line represents the median. The size of the box represents the interquartile range and the top and bottom whiskers represent the maximum and the minimum values, respectively. c, e Created in BioRender.**, P < 0.01; *, P < 0.05; Source data are provided as a Source Data file.
Fig. 2
Fig. 2. Wnt5a expression in fibroblast.
a Sample collection strategy for single-cell RNA-seq data analysis of whole cells in mouse colon cancer. Created in BioRender. b UMAP embedding of 26,392 cells from mouse colon cancer models, colored by cell type. pDC plasmacytoid dendritic cell, cDC conventional dendritic cell, Sm.mus smooth muscle cell, Vas.endo vascular endothelial cell, Lym.endo lymphatic endothelial cell, NK natural killer cell, Tgd gamma delta T cell. c UMAP plot for Wnt5a. d Expression levels of Wnt5a across cell types are shown in a dot plot. Dot size indicates the proportion of expressing cells, colored by mean expression values in each cell type. e UMAP plots for Pdpn, Pdgfra, and Lum. f, g Tissue sections from AOM/DSS-derived tumors were stained with indicated antibodies and DAPI. f The region in the yellow solid square is shown enlarged in the bottom right panel (Scale bar for enlarged image, 20 μm). Scale bars, f 100 μm, g (upper) 100 μm, (lower) 50 μm.
Fig. 3
Fig. 3. Expression profile of Wnt5a from single-cell RNA-seq meta-analysis of human colon fibroblasts.
a Sample collection strategy for single-cell RNA-seq data meta-analysis of fibroblasts from human colon. Created in BioRender. b The density of cells per condition is plotted in UMAP embedding. c Abstracted graph of neighborhoods was superimposed on UMAP embedding using milopy package, where each node represents a neighborhood and is colored by their log2(fold change) between healthy state and disease (IBD and CRC) state. FC, fold change. d The optimal number of components for NMF was determined using an elbow plot. The maximum correlation (y-axis) refers to the highest correlation coefficient between the original data and the reconstructed data for a given number of components (x-axis). The optimal number of components, 8, is marked in orange. e For each program, the NMF feature weights, representing gene program activity scores, of each cell are plotted in UMAP embeddings. f The gene weights of the top 5 genes in each program are shown as a heatmap. g UMAP embedding of fibroblasts from human colon tissue, colored by cell type. Cell type annotation was defined based on the program activated in the cell type. h NMF feature weights of each cell are presented as a stacked violin plot. For visualization, the weights were min-max scaled across all cells for each program, with colors representing median weights. i (Upper) UMAP plot for WNT5A. (Lower) Expression levels of WNT5A across cell types are shown in a dot plot. Dot size indicates the proportion of expressing cells, colored by mean expression values in each cell type. j Expression levels of WNT5A in InfFib among the state of health are shown in a violin plot. k The proportion of fibroblast subtypes among the states of health is shown in a stacked bar plot. l The proportion of fibroblast subtypes in colon adenocarcinoma tissue and normal tissue adjacent to the tumor was inferred from bulk RNA-seq data of TCGA-COAD cohort using deconvolution method, and is visualized as a stacked bar plot. m The proportion of fibroblast subtypes in colon tissue from healthy donors and IBD patients was inferred from bulk RNA-seq data using deconvolution method, and is visualized as a stacked bar plot. n Spatial plots for InfFib cell density and WNT5A expression using two independent datasets of human colon cancer. The regions enclosed by the yellow dashed line indicate the areas where InfFib and expression of WNT5A are enriched near the luminal side.
Fig. 4
Fig. 4. Profiling of Wnt5a-expressing fibroblasts in mouse colon cancer model.
a Sample collection strategy for single-cell RNA-seq (scRNA-seq) data meta-analysis of fibroblasts from mouse colon cancer models. For AOM/DSS model, fibroblasts were isolated by FACS to prepare samples for scRNA-seq. b Schematic representation of NMFproj. c UMAP plots for NMF-based programs. For each program, the weights of each cell are plotted in UMAP embeddings. The weights were calculated based on projected gene features from NMF of human colon fibroblast atlas dataset. d UMAP embedding of 8550 fibroblasts from mouse colon cancer model, colored by cell type. Cell type annotation was defined based on the program activated in the cell type. e UMAP embeddings for healthy mouse fibroblasts (left) and DSS-treated mouse fibroblasts (right) obtained from a previous report projected into the mouse tumor fibroblast reference map. f Human colon fibroblast atlas and mouse colon tumor fibroblasts data were projected in the same UMAP embedding. g Z-score normalized alignment scores between cell types related to (f) are represented in a correlation matrix plot. h Sample collection strategy for scRNA-seq data meta-analysis of fibroblasts from normal and inflamed mouse intestines, and intestinal mouse tumors. The two tumor-derived datasets are the same as those used in (a). i UMAP plots of mouse colon fibroblasts related to (h) for NMF-based programs. For each program, the weights of each cell are plotted in UMAP embedding. The weights were calculated based on projected gene features from NMF of human colon fibroblast atlas dataset. j UMAP embedding of 46,843 fibroblasts related to (h), colored by cell type. Cell type annotation was defined based on the program activated in the cell type. k UMAP embeddings of fibroblasts related to (j) for each disease states, colored by cell type. l The subtype proportion of fibroblasts in each condition related to (k) is plotted in a stacked bar plot. m Mean scaled expression levels of the top 5 cell type-specific genes in each fibroblast subtype are illustrated as a heatmap. For visualization, the expression levels were min-max scaled across all cells for each gene. a, h Created in BioRender. Source data are provided as a Source Data file.
Fig. 5
Fig. 5. Alteration of cell-type composition in colon cancer by Wnt5a depletion.
a (Upper) UMAP plot of fibroblasts from mouse colon cancer models related to Fig. 4d for Wnt5a. (Lower) Expression levels of Wnt5a across cell types are shown in a violin plot. b, c Tissue sections from AOM/DSS-derived tumors were stained with indicated antibodies including anti-Lama1 (feature gene of BMPsFib) or anti-Mmp10 (feature gene of InfFib) antibody and DAPI. b The region in the yellow solid square is shown enlarged in the right panels. Scale bars, b (left) 100 μm, (right) 20 μm, c 50 μm. d The relative change in abundance of whole cell types between control and Wnt5a cKO-derived AOM/DSS-induced tumors (n = 4 per group) was inferred from bulk RNA-seq data of tumor tissues using the deconvolution method and is visualized as a bubble plot. The x-axis represents statistical significance, and the y-axis represents the cell type. The color of the bubble indicates the amount of change in the proportion of cells. FC fold change. (Multiple t-test, Two-tailed, Holm-Sidak’s multiple comparisons test). e The proportion of indicated cell types in control or Wnt5a cKO-derived AOM/DSS-induced tumors was inferred from bulk RNA-seq data of tumor tissues using the deconvolution method and is visualized as a stacked bar plot. f Expression levels of InfFib marker genes between control and Wnt5a cKO-derived AOM/DSS-induced tumors are shown in bar plots. mRNA expression values were obtained from bulk RNA-seq data used in (d). (n = 4; Unpaired t-test, Two-tailed). g, h Tissue sections from control (n = 6 lesions from 3 or 4 mice) or Wnt5a cKO (n = 6 lesions from 3 mice)-derived tumors were stained with indicated antibodies and DAPI. The results are shown as the percentage of (g) Mmp10- or (h) Il11-positive area compared to the total Pdpn-positive area proximity to the lumen (within 75 μm from the edge) and presented as a bar plot. Scale bars, 50 μm. (Unpaired t-test, Two-tailed). i Scatter plots showing the correlation between WNT5A gene expression levels (x-axis) and signature scores of the top 50 weighted genes from the Inflammatory_Program (y-axis; left) or InfFib proportion estimated in Fig. 3l (y-axis; right) were obtained from TCGA-COAD patient dataset. A regression line was fitted using linear regression, and the shaded area represents the 95% confidence interval. The Spearman R- and P-values are shown on the top. ***, P < 0.001; **, P < 0.01; *, P < 0.05; Source data are provided as a Source Data file.
Fig. 6
Fig. 6. Induction of InfFib and Wnt5a expression via hypoxia.
a (Left) Force-directed graph embedding for mouse colon cancer fibroblast single-cell RNA-seq (scRNA-seq) data related to Fig. 4a. Cell type labels were from Fig. 4d. (Right) PAGA plot on force-directed graph embedding. b Force-directed graph embedding depicting diffusion pseudotime. c Force-directed graph embedding colored by CytoTRACE scores. A lower score indicates more differentiated states. d Changes of marker gene expression, CytoTRACE score, and hypoxia activity along PAGA path during pseudotime progression are shown. Marker genes for InfFib, Il1rl1 and Mmp10; BMPsFib, Syt13 and Lama1. DPT, diffusion pseudotime. e, f Pathway activities in each fibroblast subtype from mouse (e) or human (f) scRNA-seq data related to Fig. 4d or 3g, respectively, were inferred and  are represented in heatmaps. g, h FFPE (g) or fresh-frozen (h) tissue sections from AOM/DSS treated mice after injection of pimonidazole were stained with indicated antibodies and DAPI. Scale bars, g 100 μm, h 20 μm. i Scatter plots showing the correlation between signature scores of hypoxia (x-axis) and (left) InfFib or (right) BMPsFib proportion estimated in Fig. 3l (y-axis) were obtained from TCGA-COAD patient dataset. A regression line was fitted using linear regression, and the shaded area represents the 95% confidence interval. The Spearman R- and P-values are shown on the top. j WEHI-YH2 cells were treated with CoCl2 for 24 h and subjected to bulk RNA-seq. Signature scores for each subtype are represented as strip plots. (n = 3; Unpaired t-test, Two-tailed). k WEHI-YH2 cells were exposed to CoCl2 or 1% O2 for indicated duration. The mRNA levels of the indicated genes are represented in bar plots. (n = 3; One-way ANOVA, Holm-Sidak’s multiple comparisons test). l WEHI-YH2 cells were exposed to 20% or 1% O2 for 24 h, and Wnt5a was precipitated from conditioned media. The precipitates (CM) and total cell lysates (Lysate) were probed with different antibodies: the former was probed for anti-Wnt5a antibody, and the latter was probed for anti-Hsp90 antibody as a loading control. m Tissue sections from control or Wnt5a cKO-derived tumors (n = 3 different tumors) were stained with anti-hypoxyprobe antibody and DAPI. The results are shown as the percentage of hypoxyprobe-positive area compared to the total area proximity to the lumen (within 75 μm from the edge) and presented as a bar plot. Scale bars, 100 μm. (Unpaired t-test, Two-tailed). ***, P < 0.001; **, P < 0.01; *, P < 0.05; ns, P > = 0.05; Source data are provided as a Source Data file.
Fig. 7
Fig. 7. Expression of Wnt5a via HIF2α.
a, b Fresh-frozen tissue sections from AOM/DSS-treated mouse tumors were stained with indicated antibodies and DAPI. Scale bars, 50 μm. c Tissue sections from human colon cancer specimens (n = 5) were stained with indicated antibodies. The tumor was divided into the luminal surface and the core region, and the proportion of fibroblasts with nuclear HIF2α was calculated for each. The results are shown as the percentage of fibroblasts with nuclear HIF2α compared to the total fibroblasts and presented as a bar plot. Scale bars, 100 μm. (Unpaired t-test, Two-tailed; P < 0.0001). d Either HIF1α or HIF2α were introduced into X293T (left) or WEHI-YH2 (right) cells. The mRNA levels of Wnt5a gene were measured by quantitative RT-PCR, and the results are represented in a bar plot. (n = 3; (left) One-way ANOVA, Holm-Sidak’s multiple comparisons test; (right) unpaired t-test, two-tailed; (left) P = 0.2657, P = 0.0378 from left to right; (right) P = 0.0133). e WEHI-YH2 cells were transfected with control or HIF2α siRNA for 36 h, and were exposed to 20% (normoxia) or 1% (hypoxia) O2 for 24 h. The mRNA levels of indicated genes were measured by quantitative RT-PCR, and the results are represented in bar plots. Scr, Scramble. (n = 3; One-way ANOVA, Holm-Sidak’s multiple comparisons test; (left) P < 0.0001, P < 0.0001, P = 0.0859, P < 0.0001, P < 0.0001 from left to right; (right) P = 0.0183, P = 0.0426, P = 0.0035, P = 0.0043, P = 0.0426 from left to right). f Cistrome Data Browser images show HIF2α ChIP-seq and ATAC-seq signals at Wnt5a gene loci. ChIP-seq and ATAC-seq data for mouse uterus were obtained from GSE234065. g Enrichment of HIF2α within the Wnt5a promoter region in WEHI-YH2 cells upon CoCl2 treatment for 24 h were measured by ChIP-qPCR. The results are shown as the percentage of input and presented as a bar plot. ***, P < 0.001; **, P < 0.01; *, P < 0.05; ns, P > = 0.05; Source data are provided as a Source Data file.
Fig. 8
Fig. 8. Induction of InfFib by inflammation.
a Tissue sections from AOM/DSS-treated mouse tumors were stained with indicated antibodies and DAPI. Scale bars, 50 μm. b WEHI-YH2 cells were treated with TNFα (5 ng/mL) for 24 h and subjected to bulk RNA-seq. Signature scores for each subtype are represented as strip plots. (n = 3; **, P < 0.01; ns, P > = 0.05; Unpaired t-test, Two-tailed; CancerFib, P = 0.3638; BMPsFib, P = 0.0026; ChemoFib, P = 0.8453; InfFib, P = 0.0021; MyoFib, P = 0.0016; AlarmFib, P = 0.0901). c A scatter plot showing the correlation between signature scores of inflammation (x-axis) and InfFib proportion estimated in Fig. 3l (y-axis) was obtained from TCGA-COAD patient dataset. A regression line was fitted using linear regression, and the shaded area represents the 95% confidence interval. The Spearman R- and P-values are shown on the top. Source data are provided as a Source Data file.
Fig. 9
Fig. 9. Regulation of angiogenesis by Wnt5a.
a Tissue sections from control (n = 3 different tumors from 2 mice) or Wnt5a cKO (n = 3 different tumors from 2 mice)-derived tumors were stained with anti-Cd31 antibody and DAPI. The results are shown as the percentage of Cd31 positively stained area compared to the total Pdpn-positive area proximity to the lumen (within 75 μm from the edge) and presented as a bar plot. Scale bars, 200 μm. (Unpaired t-test, Two-tailed). b Tissue sections from control or Wnt5a cKO-derived tumors were stained with indicated antibodies and DAPI. Scale bars, 50 μm. c HUVEC were cultured in control or Wnt5a CM and subjected to tube formation assay. After incubation for 6 h, number of segments and total length of tubes were quantified for each condition, and the results are presented as bar plots. Scale bars, 300 μm. (n = 5; Unpaired t-test, Two-tailed). d HUVEC were treated with rWnt5a and subjected to tube formation assay. After incubation for 20 h, number of segments and total length of tubes were quantified, and the results are presented as bar plots. Scale bars, 300 μm. (n = 5; One-way ANOVA, Holm-Sidak’s multiple comparisons test). e HUVEC spheroids were seeded on Matrigel layer for sprouting assay. After incubation for 7 h with or without rWnt5a (400 ng/mL) treatment, length of the sprouts was measured and the results are presented as mean in a bar plot. Scale bars, 100 μm. (n = 4; Unpaired t-test, Two-tailed). f HUVEC were cultured in control or Wnt5a CM for 12 h. The mRNA levels of the sFlt1 are represented in a bar plot. (n = 3; Unpaired t-test, Two-tailed). g HUVEC were treated with rWnt5a for 12 h. The mRNA levels of the sFlt1 are represented in a bar plot. (n = 3; One-way ANOVA, Holm-Sidak’s multiple comparisons test). h After HUVEC were cultured with or without rWnt5a (400 ng/mL) treatment for 12 h, CM was collected and the concentration of sFlt1 was measured by ELISA. The results are represented in a bar plot. (n = 3; Unpaired t-test, Two-tailed). i HUVEC were treated with rWnt5a (400 ng/mL), CsA (10 μM), or both for 12 h. The mRNA levels of sFlt1 are represented in a bar plot. CsA, Cyclosporin A. (n = 3; One-way ANOVA, Holm-Sidak’s multiple comparisons test). j Expression levels of ROR1, ROR2, and RYK across cell types in Human Colon Cancer Atlas related to Supplementary Fig. 2h are shown in a dot plot. Dot size indicates the proportion of expressing cells, colored by mean expression values in each cell type. k HUVEC were treated with rWnt5a (400 ng/mL) for 12 h following transfection with control or RYK siRNA for 48 h. The mRNA levels of the indicated genes are represented in bar plots. Scr, Scramble; Cont, Control. (n = 3; One-way ANOVA, Holm-Sidak’s multiple comparisons test). l Tissue sections from control mouse-derived tumors were stained with indicated antibodies and DAPI. Scale bars, 20 μm. Yellow arrowheads indicate Cd31 positive endothelial cells. m PLA with anti-Wnt5a and anti-Ryk antibodies was performed on tissue sections from control mouse-derived tumors, and they were counterstained with DAPI. Scale bars, 20 μm. n Spatial plots for endothelial cell (Endo), InfFib, macrophage (Macro), monocyte (Mono) cell density in human colon cancer related to Fig. 3n and Supplementary Fig. 11f. The region where WNT5A is enriched is outlined with a yellow dashed line. o Scatter plots showing the correlation between cell density of two cell types within the region outlined by the yellow dashed line in (n). A regression line was fitted using linear regression, and the shaded area represents the 95% confidence interval. The Pearson R- and P-values are shown on the top. ***, P < 0.001; **, P < 0.01; *, P < 0.05; ns, P > = 0.05; Source data are provided as a Source Data file.
Fig. 10
Fig. 10. Pro-tumorigenic role of EREG secreted from InfFib.
a CACO-2 cells were cultured in CM prepared from WEHI-YH2 cells under 20% or 1% O2 conditions. Proliferative abilities are presented as mean ± SD. (n = 4; Unpaired t-test, Two-tailed). b, c Expression levels of EGF ligand family across fibroblast subtypes in mouse (b) and human (c) single-cell RNA-seq data related to Fig. 4d or 3g, respectively, are shown in dot plots. Dot size indicates the proportion of expressing cells, colored by mean expression values in each cell type. d UMAP plot of cells from mouse colon cancer models related to Fig. 2b for Ereg. e Expression levels of Ereg between control and Wnt5a cKO-derived AOM/DSS-induced tumors are shown in a bar plot. mRNA expression values were obtained from bulk RNA-seq data used in Fig. 5d. (n = 4; Unpaired t-test, Two-tailed). f WEHI-YH2 cells were exposed to 1% O2 or CoCl2 for 48 h, or overexpressed with HIF2α. The mRNA levels of Ereg are represented in bar plots. (n = 3; Unpaired t-test, Two-tailed). g CACO-2 cells were cultured in CM prepared from WEHI-YH2 cells expressing EREG. Proliferative abilities are presented as mean ± SD. (n = 4; Unpaired t-test, Two-tailed). h Organoids established from AOM/DSS-derived tumors were treated with rEREG or rEGF and cultured for 6 days. Representative phase-contrast images are shown. Scale bars, 500 μm. i Organoids established from AOM/DSS-derived tumors treated with or without rEREG were exposed to 20% or 1% O2 for 48 h. The left panels are phase-contrast images. Mean area of organoids in each condition was measured for three experiments, and the results are represented in a bar plot. Scale bars, 500 μm. (n = 3; One-way ANOVA, Holm-Sidak’s multiple comparisons test). j Differentially expressed genes between control and Wnt5a cKO-derived AOM/DSS-induced tumors were subjected to pathway activity inference using decoupleR. mRNA expression values were obtained from bulk RNA-seq data used in Fig. 5d. k Organoids established from AOM/DSS-derived tumors were treated with 200 ng/mL rEREG for 2 days and EdU. Organoids were stained with indicated antibodies and DAPI, and representative images are shown. Scale bars, 20 μm. l Scatter plots showing the correlation between signature scores of MAPK (x-axis) and WNT5A gene expression levels (y-axis) were obtained from TCGA-COAD patient dataset. A regression line was fitted using linear regression, and the shaded area represents the 95% confidence interval. The Spearman R- and P-values are shown on the top. m Violin plots showing the mRNA expression levels of indicated genes among CMS subtypes in TCGA-COAD patient dataset. The width of each violin indicates the kernel density estimation of the data distribution. The central white dot represents the median, the thick bar in the center corresponds to the interquartile range (IQR), and the thin line extending from the bar denotes the data range within 1.5 times the IQR. (CMS1, n = 65; CMS2, n = 133; CMS3, n = 51; CMS4, n = 95; One-way ANOVA, Holm-Sidak’s multiple comparisons test). n Graphical abstract of this study. Created in BioRender. ***, P < 0.001; **, P < 0.01; *, P < 0.05; Source data are provided as a Source Data file.

References

    1. Haggar, F. A. & Boushey, R. P. Colorectal cancer epidemiology: incidence, mortality, survival, and risk factors. Clin. Colon Rectal Surg.22, 191–197 (2009). - PMC - PubMed
    1. Guinney, J. et al. The consensus molecular subtypes of colorectal cancer. Nat. Med.21, 1350–1356 (2015). - PMC - PubMed
    1. Quail, D. F. & Joyce, J. A. Microenvironmental regulation of tumor progression and metastasis. Nat. Med.19, 1423–1437 (2013). - PMC - PubMed
    1. Brugger, M. D. & Basler, K. The diverse nature of intestinal fibroblasts in development, homeostasis, and disease. Trends Cell Biol33, 834–849 (2023). - PubMed
    1. Joanito, I. et al. Single-cell and bulk transcriptome sequencing identifies two epithelial tumor cell states and refines the consensus molecular classification of colorectal cancer. Nat. Genet.54, 963–975 (2022). - PMC - PubMed

LinkOut - more resources