. 2025 Apr 17;16(1):3689.
doi: 10.1038/s41467-025-58977-y.

Disease-specific B cell clones are shared between patients with Crohn's disease

Affiliations

Disease-specific B cell clones are shared between patients with Crohn's disease

Prasanti Kotagiri et al. Nat Commun. .

Abstract

B cells have important functions in gut homeostasis, and dysregulated B cell populations are frequently observed in patients with inflammatory bowel diseases, including both ulcerative colitis (UC) and Crohn's disease (CD). How these B cell perturbations contribute to disease remains largely unknown. Here, we perform deep sequencing of the B cell receptor (BCR) repertoire in four cohorts of patients with CD, together with healthy controls and patients with UC. We identify BCR clones that are shared between patients with CD but not found in healthy individuals nor in patients with UC, indicating CD-associated B cell immune responses. Shared clones are present in the inflamed gut mucosa, draining intestinal lymph nodes and blood, suggesting the presence of common CD-associated antigens that drive B cell responses in CD patients.


Conflict of interest statement

Competing interests: The authors declare no competing interests.

Figures
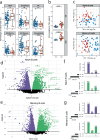
Fig. 1
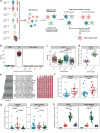
Fig. 1. Increased plasmablasts and altered gene expression in B cells of patients with Crohn’s disease.
a B cell immunophenotyping. Boxplots showing proportions of B cell populations, by disease group. Unpaired two-sided Wilcoxon’s signed-rank test. Naive (CD19+IgD+CD27), double-negative (DN) B cells (CD19+IgDCD27), non-switched (NS) memory (CD19+CD27+IgD+), switched (SW) memory (CD19+IgDCD27+) and plasmablasts (CD19−/lowCD20CD27+CD24-CD38+) and transitional B cells (CD19+IgD+CD27 CD24+ CD38+). Healthy individuals (n = 53) and CD (n = 15). HC coloured in blue and CD coloured in red. b Immunoglobulin titres. Boxplot of immunoglobulin titres split according to isotype and disease. Immunoglobulin titres in healthy individuals (n = 4), patients with CD (n = 20). Unpaired two-sided t-test. HC coloured in blue and CD coloured in red. c Assessment of transcriptional differences in B cells. PCA plot of naïve and memory B cells comparing CD with HC. HC coloured in blue and CD coloured in red. d Differential gene expression in naïve B cells. Volcano plot representing differentially expressed genes between HC and CD (Benjamini–Hochberg correction, FDR <0.05). Upregulated genes in green and downregulated genes in purple. p values and FDRs are determined by moderated t-tests and multiple test corrections using limma. e Differential gene expression in memory B cells. Volcano plot representing differentially expressed genes between HC and CD (Benjamini–Hochberg correction, FDR <0.05). Upregulated genes in green and downregulated genes in purple. p values and FDRs are determined by moderated t-tests and multiple test corrections using limma. f Differential gene expression in naive B cells in IBD. Interaction plot illustrating differentially expressed genes in CD and UC compared with health. Upregulated genes in green and downregulated genes in purple. The gene distribution is indicated by the lines and dots with the number of genes sharing that disease group distribution indicated by the vertical histogram bars. The total number of upregulated/downregulated genes identified in each disease group when compared with health is indicated in the histogram to the left of the plot. g Differential gene expression in memory B cells in IBD. Interaction plot illustrating differentially expressed genes in CD and UC compared with health. Upregulated genes in green and downregulated genes in purple. The gene distribution is indicated by the lines and dots with the number of genes sharing that disease group distribution indicated by the vertical histogram bars. The total number of upregulated/downregulated genes identified in each disease group when compared with health is indicated in the histogram to the left of the plot. For cg, naïve B cells (HC = 49, CD = 24 and UC = 32) and memory B cells (HC = 54, CD = 26 and UC = 26). Boxplots show the median (centre line) and interquartile range (25th–75th percentile of the data) and whiskers indicate range of data 1.5 times the interquartile below and above the 25th and 75th percentile, respectively.
Fig. 2
Fig. 2. Evidence for common antigens in Crohn’s disease through analysis of B cell clonal sharing.
a Schematic of shared clones. Peripheral blood mononuclear cells (PBMC), lymph nodes (LN), healthy controls (HC), mediastinal lymph nodes (MDLN), mesenteric lymph nodes (MSLN), post-mortem (PM). Created in BioRender. Kotagiri, P. (2024) BioRender.com/c85s966. b Assessment of clonal sharing. Randomly selected 8 patients per group and 1500 unique clones per patient (200 iterations). Boxplots of the number of clones shared in at least two patients split according to group. Each dot represents an iteration. c Isotype-specific clonal sharing in CD LN. Randomly selected 16 patients per isotype and 500 unique clones per patient (200 iterations). Boxplots of the number of clones shared in at least two patients split according to isotype. Each dot represents an iteration. Unpaired two-sided Wilcoxon’s signed-rank test. d Identified potentially CD-associated LN clones. Clones were identified based on the presence of two or more CD-inflamed LN samples and the absence of MSLN from the post-mortem cohort. Boxplot of convergence in IGHM-IGHD and class-switched clones in CD LN BCR repertoire. Each dot represents a sample. Unpaired two-sided Wilcoxon’s signed-rank test. n = 24. e Dominant clones: 20 most frequent CD clones identified in LN. Horizontal bars present the number of LN samples a given clone is present in. Lines connecting dots on the right illustrate the pattern of co-existence of multiple of clones in a given sample. The dot symbolises the presence of the clone in the combination. f Validation of CD-associated LN clones in PBMCs. Boxplots of enrichment. Each dot represents a sample. Unpaired one-sided Wilcoxon’s signed-rank test. Healthy individuals (n = 29) and CD (n = 24). g Validation of CD-associated LN clones in plasmablasts. Assessed clonal convergence of the list of refined CD-associated clones derived from LN in plasmablasts according to unique UMI and not unique clone, thus taking clonal expansion into consideration. Boxplot representing convergence split according to isotype and disease. Each dot represents a sample. Unpaired one-sided Wilcoxon’s signed-rank test. h Shared clones in UC. UC-associated clones were identified based on the presence in two or more UC plasmablast samples and absent in health. Boxplot of convergence in IGHM and class-switched clones in HC, UC, CD and Idiopathic pulmonary fibrosis (IPF) BCR repertoire. Each dot represents a sample. Unpaired two-sided Wilcoxon’s signed-rank test. For g, h n = 46 for healthy individuals and n = 20, n = 26 and n = 19, for patients with CD, UC and IPF, respectively. Boxplots show the median (centre line) and interquartile range (25th–75th percentile of the data) and whiskers indicate range of data 1.5 times the interquartile below and above the 25th and 75th percentile, respectively.
Fig. 3
Fig. 3. Antigen-driven clonal expansion of plasmablasts in active Crohn’s disease.
a SHM. BCR repertoire in plasmablasts (CD19+IgD-CD27+CD24-CD38+). The top row of boxplots depicts SHM split according to isotype and disease, averaged per sample and isotype. Each dot represents a sample. Unpaired two-sided Wilcoxon’s signed-rank test. The bottom row of boxplots assesses the proportion of lowly mutated clones, defined as SHM <1% across V region averaged per sample and isotype. Boxplot split according to isotype and disease. Each dot represents a sample. Unpaired two-sided Wilcoxon’s signed-rank test. b Germinal centre histology. Representative immunohistochemistry of germinal centres within an MSLN draining an inflamed region of the bowel during an acute flare of CD requiring surgical resection using CD3 (T cells), CD20 (B cells), BCL6 (GC B cells (or T follicular helper cells) and CD21 (follicular dendritic cells). c SHM of shared clones. Boxplot of SHM comparing non-CD and CD-associated clones in CD patients split according to isotype. Each dot represents a unique clone per patient. Unpaired two-sided Wilcoxon’s signed-rank test. For a, c, n = 46 for healthy individuals and n = 20 and n = 26 for patients with CD and UC, respectively. Boxplots show the median (centre line) and interquartile range (25th–75th percentile of the data) and whiskers indicate range of data 1.5 times the interquartile below and above the 25th and 75th percentile, respectively.
Fig. 4
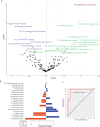
Fig. 4. Serum antibodies against Klebsiella species distinguish Crohn’s disease from ulcerative colitis and healthy controls.
a Assessment of pathogen binding differences in serum of patients with IBD and in HC. Volcano plot representing differential pathogen-specific antibody abundance between CD and HC and UC combined. Upregulated antibodies in green and downregulated antibodies in purple. Significantly differentially expressed antibodies in burgundy. P values and FDRs are determined by moderated t-tests and Benjamini–Hochberg multiple test correction using limma. b Model selection. Twenty pathogens selected by sPLS-DA as most informative in predictive models discriminating CD from HC and UC combined. Bars indicate the loading coefficient weights of selected features (ranked from most to least informative in cluster prediction, from bottom to top). c Group prediction. AUROC curve showing sensitivity and specificity of group prediction, based on the 20 pathogens selected. For ac, HC = 11, CD = 22 and UC = 9.
Fig. 5
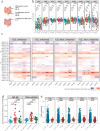
Fig. 5. Intestinal BCR repertoire analysis reveals enrichment of Crohn’s disease-associated clones.
a Schematic of study participants and sample numbers. BCR repertoires were obtained from areas of active inflammation (CD n = 27, UC n = 19) and matched less inflamed samples from the same subjects and non-IBD uninflamed controls (n = 12). Created in BioRender. Kotagiri, P. (2024) BioRender.com/z51l727. b SHM. BCR repertoire in the gut mucosa. Boxplots depict SHM split according to isotype and inflammation status averaged per sample and isotype. Each dot represents a sample. Unpaired two-sided Wilcoxon’s signed-rank test. Non-IBD control (Control), CD-inflamed (CD-I), UC-inflamed (UC-I), CD-uninflamed (CD-NI), UC-uninflamed (UC-NI). c V gene usage. Heatmap showing the difference between V gene proportion between CD and UC and controls. Difference calculated using the following method: (mean V gene proportion of disease − mean V gene proportion of HC)/(mean V gene proportion of disease + mean V gene proportion of controls). Unpaired two-sided Wilcoxon’s signed-rank test FDR adjusted p value (Benjamini–Hochberg): *p < 0.1, **p < 0.05, ***p < 0.005. d Validation of CD-associated LN clones in gut mucosa. Boxplots of enrichment. Each dot represents a sample. Unpaired one-sided Wilcoxon’s signed-rank test. e SHM of shared clones. Boxplot of SHM comparing non-CD and CD-associated clones in inflamed mucosa of CD patients, split according to isotype. Each dot represents a unique clone per patient. Unpaired two-sided Wilcoxon’s signed-rank test. For be, Non-IBD control = 12, CD-inflamed = 27, UC-inflamed = 19, CD-uninflamed = 28, UC-uninflamed = 19. Boxplots show the median (centre line) and interquartile range (25th–75th percentile of the data) and whiskers indicate range of data 1.5 times the interquartile below and above the 25th and 75th percentile, respectively.

References

    1. Martin, J. C. et al. Single-cell analysis of Crohn’s disease lesions identifies a pathogenic cellular module associated with resistance to anti-TNF therapy. Cell178, 1493–1508.e20 (2019). - PMC - PubMed
    1. Boland, B. S. et al. Heterogeneity and clonal relationships of adaptive immune cells in ulcerative colitis revealed by single-cell analyses. Sci. Immunol.5, eabb4432 (2020). - PMC - PubMed
    1. Castro-Dopico, T. & Clatworthy, M. R. Mucosal IgG in inflammatory bowel disease – a question of (sub)class? Gut Microbes12, eabb4432 (2020). - PMC - PubMed
    1. Castro-Dopico, T. et al. Anti-commensal IgG drives intestinal inflammation and type 17 immunity in ulcerative colitis. Immunity50, 1099–1114.e10 (2019). - PMC - PubMed
    1. Moor, K. et al. High-avidity IgA protects the intestine by enchaining growing bacteria. Nature544, 498–502 (2017). - PubMed

MeSH terms

Substances

LinkOut - more resources