. 2025 Apr 17;11(1):37.
doi: 10.1038/s41540-025-00509-x.

MIRO1 mutation leads to metabolic maladaptation resulting in Parkinson's disease-associated dopaminergic neuron loss

Affiliations

MIRO1 mutation leads to metabolic maladaptation resulting in Parkinson's disease-associated dopaminergic neuron loss

Alise Zagare et al. NPJ Syst Biol Appl. .

Abstract

MIRO1 is a mitochondrial outer membrane protein important for mitochondrial distribution, dynamics and bioenergetics. Over the last decade, evidence has pointed to a link between MIRO1 and Parkinson's disease (PD) pathogenesis. Moreover, a heterozygous MIRO1 mutation (p.R272Q) was identified in a PD patient, from which an iPSC-derived midbrain organoid model was derived, showing MIRO1 mutant-dependent selective loss of dopaminergic neurons. Herein, we use patient-specific iPSC-derived midbrain organoids carrying the MIRO1 p.R272Q mutation to further explore the cellular and molecular mechanisms involved in dopaminergic neuron degeneration. Using single-cell RNA sequencing (scRNAseq) analysis and metabolic modeling we show that the MIRO1 p.R272Q mutation affects the dopaminergic neuron developmental path leading to metabolic deficits and disrupted neuron-astrocyte metabolic crosstalk, which might represent an important pathogenic mechanism leading to their loss.


Conflict of interest statement

Competing interests: J.C.S. is a co-inventor on a patent covering the generation of the here-described midbrain organoids (WO2017060884A1). Furthermore, J.C.S. is a co-founder and shareholder of the company OrganoTherapeutics which makes use of midbrain organoid technology. All other authors declare no competing interests.

Figures
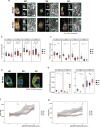
Fig. 1
Fig. 1. PD-MIRO1 mutant organoids show sustained dopaminergic neuron loss and altered astrocyte differentiation.
a Representative images of 20 and 30 day old organoids staining for neurons (TUJ1, red), dopaminergic neurons (TH, green) and nuclei (Hoechst, blue). Scale bar = 200 µm. b Quantification of total neuronal population within organoids over time quantified by pixel volume ratio (TUJ1/nuclei). n = 8 to 12 from at least 4 independent organoid derivations. c Quantification of total dopaminergic neuron population within organoids over time quantified by pixel volume ratio ((TH + TUJ1)/TUJ1). d Representative Images of 60 day old astrocytes within WT and PD organoids using GFAP (green), S100B (red) and Hoechst (nuclei, blue). Scale bar = 200 µm. e Quantification of total astrocyte population within organoids over time quantified by pixel volume ratio ((GFAP + S100B)/nuclei). n = 6 to 8 from at least 3 independent derivations. f Expression levels of GFAP protein over time quantified by the mean intense fluorescence. Statistical significance was tested with Kruskall-Walis test.*p < 0.05 (WT vs PD); ##p < 0.01 (PD vs GC); $$$p < 0.001 (WT vs GC). g Expression levels of GFAP protein over time quantified by the mean intense fluorescence. Statistical significance was tested with Kruskall-Walis test.*p < 0.05 (WT vs PD); $p < 0.05 (WT vs GC); **p < 0.01 (WT vs PD); ##p < 0.01 (PD vs GC). b, c, e Statistical significance was tested with the Kruskall-Walis test and represented with ns p > 0.05; *p < 0.05; **p < 0.01; ***p < 0.001; ****p < 0.0001.
Fig. 2
Fig. 2. Altered differentiation path of dopaminergic neurons within PD-MIRO1 mutant organoids leads to their loss over time.
a UMAP of Seurat object after integration of WT, PD and GC samples of day 30 and day 60 of differentiation. Dots represent single cells and colors represent cellular populations. b Heatmap representing cell type-specific marker expression. c Split UMAP plots of WT and PD samples of day 30 and day 60 of differentiation. c UMAP of pseudotime trajectory across cell population within the integrated Seurat object. d Pseudotime comparison between WT and PD dopaminergic neuron and THhigh dopaminergic neuron subset over time points. f Feature plot of TH expression in WT and PD dopaminergic neuron and THhigh dopaminergic neuron subset over time points.
Fig. 3
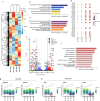
Fig. 3. PD-MIRO1 mutant dopaminergic neurons endure mitochondrial respiratory dysfunction.
a Heatmap of genes with a significant expression change along the pseudotime between day 30 and day 60 time points of WT and PD dopaminergic neurons. b Top five significantly enriched molecular function (MF) terms of top 100 genes with a significant expression change along the pseudotime between day 30 and day 60 time points of WT dopaminergic neurons. Each color represents a different MF term. c Top five significantly enriched molecular function terms of top 100 genes with a significant expression change along the pseudotime between day 30 and day 60 time points of PD dopaminergic neurons. Each color represents a different MF term. d Scaled expression of mitochondrial DNA genes in all conditions. e Volcano plot of differentially expressed genes between WT and PD dopaminergic neurons at day 60. f Top 10 significantly enriched biological processes of significantly differentially expressed genes (p.adjust.<0.05) between WT and PD dopaminergic neurons at day 60. g RNA expression of OXPHOS involved mitochondrial complex I subunit NDUFA1 and mitochondrial complex V subunit ATP5F1A genes across all conditions. Statistical significance was tested with the Wilcoxon rank sum test. Significance represented with ns p > 0.05; *p < 0.05; **p < 0.01; ***p < 0.001; ****p < 0.0001. h RNA expression of glycolysis involved hexokinase 2 (HK2), pyruvate kinase (PKM) and lactate dehydrogenase A (LDHA) genes across all conditions. Statistical significance was tested with the Wilcoxon rank sum test. Significance represented with ns p > 0.05; *p < 0.05; **p < 0.01; ***p < 0.001; ****p < 0.0001.
Fig. 4
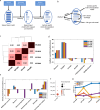
Fig. 4. Multi-cell population modeling predicts metabolic activity of midbrain organoids.
a Metabolic modeling workflow (scFASTCORMICS, see methods). b Schematic overview of reconstructed model (per one condition). c Model similarity. Jaccard similarity coefficient based on reaction presence calculated for each pair of multi-cell population models, ranging from 0 (dissimilar) to 1 (equal). d Predicted medium uptake and secretion rates of midbrain organoids for key metabolites. Positive values [a.u.] indicate uptake of the respective metabolite and negative values [a.u.] indicate secretion. e Predicted lactate inter-cellular exchange between different cell types. Negative values [a.u.] indicate production of the respective metabolite and positive values [a.u.] indicate uptake (or secretion to the medium). f Expression of SLC16A7 in dopaminergic neurons of midbrain organoids. Dot size represents the cell percentage expressing the gene, colour represents the scaled average expression. g FluxSum estimates show the metabolic dependence of the midbrain organoid conditions in each energy pathway. Estimates are done by the sum of relevant metabolites (see Supplementary Table S5) within the respective pathway. TCA- tricarboxylic acid cycle; OXPHOS- oxidative phosphorylation; FAO- fatty acid oxidation.
Fig. 5
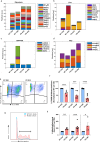
Fig. 5. Multi-cell population modeling predicts differential activities of core metabolic pathways in WT vs PD conditions.
ad Metabolic activities are estimated by calculating the FluxSum (in [a.u.]) per metabolite across all cells of the organoid (sum of incoming metabolic fluxes in FBA solution) and are shown as bar plots of key metabolites per metabolic pathway (complete metabolite names corresponding to abbreviations are summarized at Supplementary Table S5). [c]-cytoplasm; [m]-mitochondria. e Dual Fluorescence scatter plots representing mitochondria (Q1&2) with intact membrane potential (Q2) in 20 day old organoids; WT (left) & PD (right). f The graph bar represents the percentage of mitochondria with intact membrane potential over time. n = 6 to 8 from at least 3 independent derivations. Statistical significance was tested with the Wilcoxon rank sum test. Significance represented with ***p < 0.001; ****p < 0.0001. g Representative histogram of MitoSox Red positive cells in 20 day old WT (blue) and PD (red) organoids. h The Graph bar represents the percentage of events with elevated mitochondrial ROS over time. n = 4 to 8 from at least 3 independent derivations. Statistical significance was tested with the Wilcoxon rank sum test. Significance represented with *p < 0.05; **p < 0.01; ***p < 0.001.

References

    1. Przedborski, S. The two-century journey of Parkinson disease research. Nat. Rev. Neurosci.18, 251–259 (2017). - PubMed
    1. Ou, Z. et al. Global Trends in the Incidence, Prevalence, and Years Lived With Disability of Parkinson’s Disease in 204 Countries/Territories From 1990 to 2019. Front Public Health9, 776847 (2021). - PMC - PubMed
    1. Germer, E. L. et al. The Role of Rare Coding Variants in Parkinson’s Disease GWAS Loci. Front Neurol.10, 1284 (2019). - PMC - PubMed
    1. Makarious, M. B. et al. Large-scale rare variant burden testing in Parkinson’s disease. Brain146, 4622–4632 (2023). - PMC - PubMed
    1. Klosowiak, J. L. et al. Structural insights into Parkin substrate lysine targeting from minimal Miro substrates. Sci. Rep.6, 33019 (2016). - PMC - PubMed

MeSH terms

LinkOut - more resources