. 2025 Apr 17;16(1):3675.
doi: 10.1038/s41467-025-58795-2.

An oncohistone-driven H3.3K27M/CREB5/ID1 axis maintains the stemness and malignancy of diffuse intrinsic pontine glioma

Affiliations

An oncohistone-driven H3.3K27M/CREB5/ID1 axis maintains the stemness and malignancy of diffuse intrinsic pontine glioma

Wei Zhou et al. Nat Commun. .

Abstract

Diffuse intrinsic pontine glioma (DIPG), a lethal pediatric cancer driven by H3K27M oncohistones, exhibits aberrant epigenetic regulation and stem-like cell states. Here, we uncover an axis involving H3.3K27M oncohistones, CREB5/ID1, which sustains the stem-like state of DIPG cells, promoting malignancy. We demonstrate that CREB5 mediates elevated ID1 levels in the H3.3K27M/ACVR1WT subtype, promoting tumor growth; while BMP signaling regulates this process in the H3.1K27M/ACVR1MUT subtype. Furthermore, we reveal that H3.3K27M directly enhances CREB5 expression by reshaping the H3K27me3 landscape at the CREB5 locus, particularly at super-enhancer regions. Additionally, we elucidate the collaboration between CREB5 and BRG1, the SWI/SNF chromatin remodeling complex catalytic subunit, in driving oncogenic transcriptional changes in H3.3K27M DIPG. Intriguingly, disrupting CREB5 super-enhancers with ABBV-075 significantly reduces its expression and inhibits H3.3K27M DIPG tumor growth. Combined treatment with ABBV-075 and a BRG1 inhibitor presents a promising therapeutic strategy for clinical translation in H3.3K27M DIPG treatment.


Conflict of interest statement

Competing interests: The authors declare no competing interests.

Figures
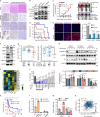
Fig. 1
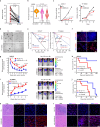
Fig. 1. CREB5 regulates ID1 expression independently of the BMP signaling pathway in H3.3K27M DIPG.
a H&E-stained sections or immunohistochemistry for H3K27M, ID1, and H3K27me3 in human non-DIPG pontine and DIPG samples. Scale bar: 50 μm. b Immunoblotting analysis of the indicated proteins in PPCs, the H3.1K27M DIPG cells (DIPG-IV), and the H3.3K27M DIPG cells (DIPG17 and TT150630). c The bioluminescence activity (left) and representative bioluminescence images (BLI) (right) in TT150630 mouse models between ID1 KD and Ctr (n = 5). d Kaplan-Meier survival analysis from animals implanted with TT150630 cells with or without ID1 KD in the pons. e Immunofluorescence images of pons sections from TT150630 PDX animals with or without ID1 KD for anti-OLIG2, anti-GFAP, and anti-β-tubulin with quantification. Scale bar: 20 μm. Right panel: quantified cell counts. f Immunoblotting analysis of indicated proteins in DIPG17 cells with or without ID1 KD. g ID1 expression across indicated DIPG subtypes from PedcBioPortal and UCSC Xena DIPG cohort. h, Immunoblotting analysis (top) and quantification (bottom) of ID1 expression in indicated DIPG cells treated with LDN-193189 (200 nM) for 0, 2, 4, and 8 hours. i Clustering heatmap showing regulon specificities in OPC-like cells. j qPCR analysis of ID1 expression in indicated DIPG cells. k Kaplan-Meier survival curves for DIPG patients from UCSC Xena cohort separated into CREB5 high and low expression groups. l, Dual-luciferase reporter assay using ID1 promoter. m qPCR analysis of CREB5 and ID1 in indicated DIPG cells. n Scatter plot showing the correlation of ID1 and CREB5 expression in clinical pediatric brain tumors (CBTTC). The p value and correlation coefficient (R) were calculated using Pearson’s correlation. The error bands indicate 95% CIs as shades based on standard error. Data presented as mean ± s.e.m. of three independent experiments (e, j, l, and m) or mean ± s.e.m. (c); statistical significance was determined by a two-tailed unpaired Student’s t-test (c, e, j, l, m, and n), log-rank test (d and k) or ordinary one-way ANOVA with Tukey test (g and h). Experiments were repeated three times independently with similar results (b, f and h). Source data are provided as a Source Data file.
Fig. 2
Fig. 2. CREB5 maintains an OPC/stem-like state and promotes tumor growth of H3.3K27M DIPG.
a Scatter plot showing the CREB5 RPKM abundance of pairwise DIPG patients (n = 18). The DIPG tumor tissues and paired normal tissues are from the same patient. b Normalized RNA expression of CREB5 from UCSC Xena DIPG cohorts in H3.3K27M, H3.1K27M, and H3 WT DIPG clinical patients. For the box plots, the hinges denote the first and third quartiles, the whiskers correspond to minimum and maximum values (excluding outliers), and the horizontal line marks the median. c Viability of indicated cells (n = 3 independent experiments). d Neural sphere formation of the Ctr or CREB5 KD DIPG17 and TT150630 cells. N = 3 independent experiments. Scale bars: 100 μm. e Extreme limiting dilution assay in DIPG17 cells and TT150630 cells with or without CREB5 KD. f Immunofluorescence images of OLIG2 and TUBB3 staining in DIPG17 cells with or without CREB5 KD. Scale bars: 50 μm. gj The bioluminescence activity in the DIPG17 (g) and TT150630 (i) PDX mouse models were plotted between CREB5 KD and Ctr (n = 5 mice in each group). Kaplan-Meier survival analysis from animals implanted with DIPG17 cells (h) and TT150630 cells (j) with or without CREB5 KD in the pons. k, l H&E-stained or immunofluorescence images of pons sections from animals implanted with TT150630 cells (k) with or without CREB5 KD and AAV-mediated shRNAs targeting CREB5 or scramble control (l), examining anti-OLIG2, anti-GFAP, and anti-β-tubulin. Scale bars: 50 μm. Data presented as mean ± s.e.m. of three independent experiments (c) or mean ± s.e.m (b, g, and i); statistical significance was determined by a two-tailed paired Student’s t-test (a), ordinary one-way ANOVA with Tukey test (b), two-tailed unpaired Student’s t-test (c, g, and i), two-tailed likelihood-ratio test (e) or log-rank test (h and j). Source data are provided as a Source Data file.
Fig. 3
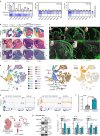
Fig. 3. Creb5 is specifically expressed in normal forebrain neural progenitors, but the presence of H3.3K27M induces Creb5 expression in the hindbrain neural progenitors.
a RNA-seq and ChIP-seq profiles of different prenatal stages of mouse forebrain (left), hindbrain (middle), and midbrain (right) showing the mRNA expression (TPM) of Creb5 and the H3K27me3 and H3K27ac signals at the promoter of Creb5. b Anatomic annotation (top) of major tissue regions based on the H&E images, UMAP embedding and spatial mapping of Creb5 gene score (middle), and Creb5 gene expression (bottom) at different developmental stages of mouse brain. The scRNA-seq and scATAC-seq data of developing mouse brain were analyzed from spatially resolved joint profiling of chromatin accessibility and gene expression. Scale bars: 1000 μm. Dpallv, ventricular zone of dorsal pallium. DPallm, mantle zone of dorsal pallium. c Immunofluorescence of sagittal developing murine brain sections showing CREB5 dynamic expression in embryonic forebrain and hindbrain. Image shown is representative of n = 3 independent replicates of experiments with similar results. Scale bars: 100 μm. d UMAP visualization of different mouse brain development stage (left), different cell clusters (middle), and Creb5 expression (right) (http://www.mousebrain.org/development/). e IGV screenshot of the locus from Hoxa cluster to Creb5 showing the signal tracks of H3K27me3 with or without H3.3K27M expression in forebrain and hindbrain mNSC neurospheres from previous study. f FPKM fold change (H3K27M/WT) of Creb5 with or without H3.3K27M overexpression in forebrain and hindbrain mNSC neurospheres from previous study. g Schematic for the introduction of H3.3K27M oncohistone in the hindbrain NPC cultures. h Immunoblotting analysis of indicated proteins in the hindbrain mNPC cultures with or without H3.3K27M introduction. Experiments were repeated three times independently with similar results. i qPCR analysis of Creb5 and Id1 with or without H3.3K27M OE in the hindbrain mNPC cells. Data presented as mean ± s.e.m. of three independent experiments, statistical significance was determined by a two-tailed unpaired Student’s t-test (f and i). Experiments were repeated three times independently with similar results (h). Panel g created in BioRender. Zhou, W. (2025) https://BioRender.com/a99h972. Source data are provided as a Source Data file.
Fig. 4
Fig. 4. Oncohistone H3.3K27M primes CREB5 activation in DIPG.
a Hi-C contact maps, RNA-seq, and ChIP-seq tracks of CTCF, H3K27me3, EZH2, H3K27ac, H3K4me1, H3K4me3, CpG islands (CGIs), and super-enhancer (SE) at HOXA1-13 and CREB5. The shading on the left denotes the promoter region of CREB5, while the shading on the right indicates the super-enhancer associated with CREB5. b qPCR analysis of CREB5 with or without H3.3K27M overexpression in PPC cells. c Immunoblotting analysis of the indicated proteins with or without H3.3K27M overexpression in PPC cells. d IGV tracks displaying H3K27M and H3K27me3 profiles in PPC cells at CREB5 locus and its neighboring HOXA1-13 gene cluster, with or without H3K27M OE. The blue shading denotes the differential binding peak of H3K27me3 at the promoter of CREB5. e qPCR analysis of H3.3K27M and CREB5 with or without H3.3K27M KD in DIPG17 cells. f Immunoblotting analysis of the indicated proteins with or without H3.3K27M KD in DIPG17 cells. g IGV tracks displaying H3K27me3 profile in DIPG17 cells at CREB5 and its neighboring HOXA1-13 gene cluster, with or without H3K27M KD. The blue shading denotes the differential binding peak of H3K27me3 at the promoter of CREB5. Data presented as mean ± s.e.m. of three independent experiments, statistical significance was determined by a two-tailed unpaired Student’s t-test (b and e). Experiments were repeated three times independently with similar results (c and f). Source data are provided as a Source Data file.
Fig. 5
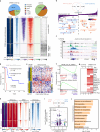
Fig. 5. CREB5 associates with the chromatin remodeling complex SWI/SNF, leading to oncogenic transcriptional changes in H3.3K27M DIPG.
a CUT&Tag profiles from DIPG17 cells showing the CREB5 binding peaks for CREB5, ATAC-seq, H3K4me3, H3K27ac, H3K27me3, and H3K9me2. Pie charts showing the percentage of CREB5 binding at the genome. b The Venn diagram (top) showing the CREB5 directly regulated genes. Waterfall plot (middle) of 920 genes that exhibited significant CREB5 binding signals within their respective promoter regions, which were also significantly regulated by CREB5. GO analysis of these genes was performed (bottom). c IGV tracks for CREB5, H3K4me3, H3K27ac, H3K27me3 CUT&Tag, and ATAC-seq in DIPG17 cells at ID1 and its neighboring gene COX4I2 gene loci (negative control, in black). d Kaplan-Meier survival curves for DIPG patients in the UCSC Xena patient cohort separated into decreased and increased survival groups. e Heatmaps illustrating CREB5-regulated genes in control (Ctr) or CREB5 KD DIPG17 cells (left panel), alongside clinical DIPG patient RNA-seq dataset depicting subgroups of decreased survival or increased survival (right panel). f GSEA analysis showing enrichment of CREB5_KD_upregulated genes in the “increased survival” group (top) and CREB5_KD_downregulated genes in the “decreased survival” group (bottom). g Heatmap showing the spectral area with log10 normalization of CREB5 interactome. N = 2 independent experiments. h Heatmap representation of CREB5 CUT&Tag signal, ATAC-seq signal and BRG1 CUT&RUN signal with or without CREB5 KD at CREB5 peaks regions sorted by promoter and enhancer region. The right panel showing ATAC-seq signals at CREB5 peaks with or without BRG1 KO. i Correlation plot illustrating the relationship between the differential DNA accessibility at selected genes’ promoter regions following BRG1 KO and the corresponding changes in gene expression upon CREB5 KD. The selected genes represent the overlap between differentially expressed genes (DEGs) identified in CREB5 KD and BRG1 KO, as illustrated in the upper Venn diagrams. The p value and correlation coefficient were calculated using Pearson’s correlation. The error bands indicate 95% CIs as shades based on standard error. j Gene Ontology (GO) and KEGG analysis on genes from (i) using DAVID. The statistical significance was determined by a two-tailed unpaired Student’s t-test (i) or two-tailed hypergeometric test (j).
Fig. 6
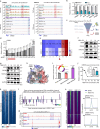
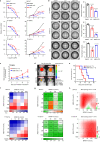
Fig. 6. Disrupting the super-enhancers using ABBV-075 inhibits CREB5 expression, consequently preventing H3.3K27M DIPG tumor growth.
a Representative IGV tracks for RNA-seq with vehicle or JQ1 treatment at a time-course and indicated ChIP-seq in DIPG cells at CREB5 gene loci. b qPCR analysis of indicated genes with vehicle or JQ1 (300 nM) treatment for 24 hours in DIPG17 cells. c Schematic of BRD4 inhibitor screening strategy. d qPCR analysis of CREB5 expression treated with series compounds for 24 hours in DIPG17 cells. e Heatmap showing the relative cell viability of DIPG17 cells and normal PPC cells treated with indicated compounds for 48 hours (n = 3). f, g Immunoblotting analysis of the indicated proteins with ABBV-075 (100 nM) treatment at indicated time points (f) and with mentioned concentrations of ABBV-075 for 24 hours (g) in DIPG17 cells. h The overall structure of molecular docking ABBV-075 (shown in blue) in complex with BRD4 protein (PDB: 3MXF). i Bar graph depicting luciferase activity of indicated reporter constructs in 293T cells. j Line graph depicting the CREB5 promoter luciferase activity with ABBV-075 treatment at various concentrations. The insert bar graph shows the luciferase activity treated with 100 nM ABBV-075 for 24 hours. k ATAC-seq profiles from DIPG17 cells showing the DNA accessibility for super-enhancer regions with or without ABBV-075 treatment (100 nM) for 24 hours. l Bar plot showing the fold change of ATAC-seq peaks with or without ABBV-075 treatment at pre-ranked super-enhancer associated genes in DIPG17 cells. m Representative IGV tracks for ATAC-seq and RNA-seq with vehicle or ABBV-075 treatment in DIPG17 cells at CREB5 gene loci. n ATAC-seq profiles from DIPG17 cells showing the DNA accessibility for CREB5 binding promoter and enhancer regions with or without ABBV-075 treatment. Metagene plot showing the average signal for ATAC-seq at CREB5-binding promoter and enhancer regions with or without ABBV-075 treatment. Data presented as mean ± s.e.m. of three independent experiments (b, d, i, and j), statistical significance was determined by a two-tailed unpaired Student’s t-test (b, d, i, and j). Experiments were repeated three times independently with similar results (f and g). Panel c created in BioRender. Zhou, W. (2025) https://BioRender.com/q17x870. Source data are provided as a Source Data file.
Fig. 7
Fig. 7. Combinatorial approach with ABBV-075 and BRG1 inhibition shows synergistic effects for H3.3K27M DIPG treatment.
a Indicated DIPG cells were treated with JQ1 and ABBV-075 with a series of concentrations for 72 hours (left). Viability of indicated cells treated with JQ1 (300 nM) and ABBV-075 (60 nM) for the number of days indicated (n = 3 independent experiments) (right). b Neural sphere formation and quantification of the TT150630, TT150714, and PPC cells treated with 0.1% DMSO, 300 nM JQ1, or 60 nM ABBV-075 for 10 days. N = 3 independent experiments. Scale bars: 1 mm. c, d The bioluminescence activity (c) was plotted with representative bioluminescence images (d) and the statistical difference between saline and ABBV-075 treatment groups from animals implanted with TT150630 cells (n = 5 mice in each group). e Kaplan-Meier analysis from animals implanted with TT150630 cells with saline or ABBV-075 treatment (n = 5) in the pons. f Cell viability matrix for DIPG17 and TT150714 DIPG cells treated with distinct ABBV-075 (y-axis) and BRM014 (x-axis) ranging from 0 to 1000 nmol/L (n = 3 independent experiments). g, h The data obtained in f were used to calculate the combination index (CI) values using Chou-Talalay via CompuSyn (g) or Bliss synergy (h) analysis and showed in heatmap matrix (CI < 1, =1, and >1 indicates synergism, addictive, and antagonism, respectively. Bliss score > 10 represents a strong synergism) (n = 3 independent experiments), representative heatmaps were shown in (g) and (h). Data presented as mean ± s.e.m. of three independent experiments (a and b) or mean ± s.e.m. (c), statistical significance was determined by a two-tailed unpaired Student’s t-test (a, b, and c) or log-rank test (e). Experiments were repeated three times independently with similar results (f and g). Source data are provided as a Source Data file.

References

    1. Jones, C. & Baker, S. J. Unique genetic and epigenetic mechanisms driving paediatric diffuse high-grade glioma. Nat. Rev. Cancer14, 651–661 (2014). - PMC - PubMed
    1. Mackay, A. et al. Integrated Molecular Meta-Analysis of 1,000 Pediatric High-Grade and Diffuse Intrinsic Pontine Glioma. Cancer Cell32, 520–537.e525 (2017). - PMC - PubMed
    1. Bjerke, L. et al. Histone H3.3 Mutations Drive Pediatric Glioblastoma through Upregulation of MYCN. Cancer Discov.3, 512–519 (2013). - PMC - PubMed
    1. Anastas, J. N. et al. Re-programing Chromatin with a Bifunctional LSD1/HDAC Inhibitor Induces Therapeutic Differentiation in DIPG. Cancer Cell36, 528–544.e510 (2019). - PubMed
    1. Srikanthan, D. et al. Diffuse intrinsic pontine glioma: current insights and future directions. Chin. Neurosurg. J.7, 6 (2021). - PMC - PubMed

MeSH terms

LinkOut - more resources