. 2025 Apr 17;16(1):3669.
doi: 10.1038/s41467-025-58999-6.

Peritoneal resident macrophages constitute an immunosuppressive environment in peritoneal metastasized colorectal cancer

Affiliations

Peritoneal resident macrophages constitute an immunosuppressive environment in peritoneal metastasized colorectal cancer

J Saris et al. Nat Commun. .

Abstract

Patients with peritoneal metastasized colorectal cancer (PM-CRC) have a dismal prognosis. We hypothesized that an immunosuppressive environment in the peritoneal cavity underlies poor prognosis. We define the composition of the human peritoneal immune system (PerIS) using single-cell technologies in 18 patients with- and without PM-CRC, as well as in matched peritoneal metastases (n = 8). Here we show that the PerIS contains abundant immunosuppressive C1Q+VSIG4+ and SPP1+VSIG4+ peritoneal-resident macrophages (PRMs), as well as monocyte-like cavity macrophages (mono-CMs), which share features with tumor-associated macrophages, even in homeostasis. In PM-CRC, expression of immunosuppressive cytokines IL10 and VEGF increases, while simultaneously expression of antigen-presenting molecules decreases in PRMs. These intratumoral suppressive PRMs originate from the PerIS, and intraperitoneal depletion of PRMs in vivo using anti-CSF1R combined with anti-PD1 significantly reduces tumor burden and improves survival. Thus, PRMs define a metastatic site-specific immunosuppressive niche, and targeting PRMs is a promising treatment strategy for PM-CRC.


Conflict of interest statement

Competing interests: A.L.Y. received consultancy fees from Janssen, Johnson & Johnson, DeciBio, and was previously employed by GSK. None of the aforementioned entities had relation to the content of this publication. L.V. received consultancy fees from Bayer, MSD, Genentech, Servier, and Pierre Fabre, but these had no relation to the content of this publication. L.V. is an employee of Genentech Inc. J.G. has a collaboration with Roche. The other authors declare no competing interests.

Figures
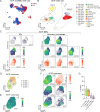
Fig. 1
Fig. 1. The homeostatic peritoneal immune system is dominated by peritoneal-resident cavity macrophages.
A Gene expression Uniform Manifold Approximation and Projection (UMAP) overlay of color coded PBMC (red) derived immune cells (n = 13,242 cells) and PF (blue) derived immune cells (n = 14,441 cells) using Harmony for batch correction. B Gene and protein weighted nearest neighbor (GP-WNN) UMAP color coded PF derived immune cells (n = 14,441 cells) identifying 27 subsets. C GP-WNN UMAP feature plots of reclustered MNPs in PF of HCs showing log transformed expression of scRNA markers used for myeloid subset identification DCs: CLEC4C, XCR1, and CD1C and CITE-seq CD1C; mononocytes + macrophages: ITGAM, MARCO, CD14, CCR2, and CD163 and CITE-Seq (CD14, CD192 and CD163). D GP-WNN UMAP color coded PF derived monocytes + macrophages (n = 3,937 cells) identifying 4 clusters. E GP-WNN UMAP feature plot of reclustered monocytes + macrophages PF of HCs showing log transformed expression of VSIG4. F GP-WNN UMAP feature plots of reclustered monocytes + macrophages in PF of HCs showing log transformed expression of scRNA markers CD163, VCAN, CCR2, C1QA, SPP1, and CD163 (CITE-Seq). G Boxplot showing the annotation and subsequent proportion of monocytes + macrophages subsets relative to total MNPs in PF of HCs (n = 5 donors) (does not add to 100% as DC subsets are not included in the graph). Box: 25th to 75th percentiles; line: median; whiskers: minimum and maximum values. UMAP Uniform Manifold Approximation and Projection, scRNA-seq single cell RNA sequencing, CITE-seq cellular indexing of transcriptomes and epitopes sequencing, HC healthy controls, PBMC peripheral blood mononuclear cell, PF peritoneal fluid, Mono-macs monocytes + macrophages, MNPs mononuclear phagocytes, T T cells, NK/ILC natural killer cells/innate lymphoid cells, B B cells, TCM T central memory, Treg regulatory T, CTL cytotoxic T lymphocyte, TEM T effector memory, MAIT mucosal-associated invariant T, GDT gamma delta T cells, NKT natural killer T, CDC1s conventional dendritic cells type 1, CDC2s conventional dendritic cells type 2, PDCs plasmacytoid dendritic cells, DCs dendritic cells, Class classical, mono-CM monocyte-like cavity macrophage, CM cavity macrophage. Source data are provided as a Source Data file.
Fig. 2
Fig. 2. Peritoneal-resident cavity macrophages are immunosuppressive by nature.
A Radarplot showing TAM median Ucell score signature per macrophage subset in PF. B Dot plot of selected genes encoding pro- (red) or anti-inflammatory (green) genes in all four monocytes + macrophages subsets. C Heatmap showing the row-scaled mean log2transformed expression of top 5 unique marker proteins per monocytes + macrophages subset. D GP-WNN UMAP feature plots of reclustered mononocytes + macrophages showing log transformed expression of C1QA and SPP1 in healthy PF, colon, and liver tissue. E Boxplot analysis of monocytes + macrophages, C1Q+ CMs, and SPP1+ CMs comparing PF (n = 5 donors), colon (n = 5 donors), and liver (n = 5 donors). Box: 25th to 75th percentiles; line: median; whiskers: minimum and maximum values. Statistics: Mann–Whitney test, two-tailed. *p = 0.032, **p = 0.0079. UMAP Uniform Manifold Approximation and Projection, scRNA-seq single cell RNA sequencing, CITE-seq cellular indexing of transcriptomes and epitopes sequencing, HC healthy controls, PF peritoneal fluid, Mono-macs monocytes + macrophages, mono-CM monocyte-like cavity macrophage, CM cavity macrophage, RTM resident-tissue macrophages, Angio pro-angiogenic, IFN interferon-primed, INFLAM inflammatory-cytokine enriched, LA lipid-associated, Prolif proliferating, Reg immune regulatory, pro-inflam pro-inflammatory, anti-inflam anti-inflammatory. Only statistically significant differences are shown (*p ≤ 0.05; **p ≤ 0.01). Source data are provided as a Source Data file.
Fig. 3
Fig. 3. Peritoneal resident macrophages shape an immunosuppressive niche for PM-CRC.
A UMAP color-coded PF-derived macrophage subsets (n = 8661 cells) comparing HC (left) and PM-CRC (right) identifying 4 macrophage subsets. B Stacked bar chart analysis of macrophage subsets as a proportion of macrophages comparing PF of HC to PM-CRC. C Heatmap showing effect size comparing PM-CRC with HC (Wald statistic) as obtained using DESeq2 of significant altered genes in either HC (turquoise) or PM-CRC (brown) of macrophage subsets from selected KEGG pathways. DESeq2 Wald test derived p values. D Bar chart showing mean with SEM of absolute gene expression levels of HLA-DRB1, HLA-C, IL10, and VEGFA in all macrophage subsets in PF comparing HC (n = 5 donors) with PM-CRC (n = 13 patients). Statistics: Wald test using DESeq2. Multiple comparison adjustments and adjusted p values are used for testing. HLA-DRB1: **p = 0.007; *p = 0.014; HLA-C: *p = 0.022; ***p = 0.0003; IL10: *p = 0.035; 0.037; 0.039; VEGFA: **p = 0.007; 0.008. E Normalized Protein Expression (NPX) levels of IL-10 and VEGFA, using Olink technology in PF comparing HC (n = 5 donors) to PM-CRC patients (n = 12 patients). Line at median. Statistics: Mann–Whitney test, two-tailed. ***p = 0.0006; 0.0003. F Correlation plot of NPX levels of IL-10 and VEGFA in the PF of PM-CRC patients (n = 21 patients) and PCI score. Statistics: Spearman correlation. *p = 0.043; 0.030 (two-tailed). G UMAP color-coded PF and PM-CRC (non-)immune subsets (n = 35,329 cells). H Feature plots of (non-)immune subsets identified in g, showing log-transformed expression of scRNA markers IL10 and VEGFA. UMAP Uniform Manifold Approximation and Projection, HC healthy controls, PM-CRC peritoneal metastasized colorectal cancer, CMs cavity macrophages, mono-CMs monocyte-like cavity macrophages, rec receptor, KEGG Kyoto Encyclopedia of Genes and Genomes, PCI Peritoneal Cancer Index, NPX Normalized Protein Expression, NK/ILC natural killer cells/innate lymphoid cells, Mono-macs monocytes + macrophages. Only statistically significant differences are shown (*p ≤ 0.05; **p ≤ 0.01; ***p ≤ 0.001). All UMAPs in this figure were generated using only gene expression data. Source data are provided as a Source Data file.
Fig. 4
Fig. 4. Peritoneal-resident immunosuppressive macrophages infiltrate PMs.
A UMAP color coded for PMs from PM-CRC patients derived mono-mac subsets (n = 8 patients; 1,747 cells). B Boxplot of proportion of macrophage subsets out of total macrophages in PMs from PM-CRC patients (n = 8 patients). Box: 25th to 75th percentiles; line: median; whiskers: minimum and maximum values. Statistics: Mann–Whitney test, two-tailed. *p = 0.038, **p = 0.0019; 0.003, ***p = 0.0002. C Feature plot showing VSIG4 expression in PM derived monocytes + macrophages subsets. D UMAP color coded for monocytes or macrophages for HC (n = 5 patients) as well as the PM-CRC patients (n = 8 patients) of PBMC-, PF-, and, from PM-CRC only, PM-derived monocytes and macrophages (n = 17,930 cells) using Harmony for batch correction. E UMAP color coded for tissue and disease state of monocytes and macrophages for HC (n = 5 patients) as well as the PM-CRC patients (n = 8 patients) of PBMC-, PF- and, from PM-CRC only, PM-derived monocytes and macrophages (n = 17,930 cells) using Harmony for batch correction. F Dendrogram based on the Euclidian pairwise distances calculated between monocytes and macrophage samples obtained from HC (n = 5 patients) and PM-CRC patients (n = 8 patients). G Schematic overview of experimental set-up of PKH26 in vivo macrophage labeling (Created in BioRender. Vermeulen, J. (2025) https://BioRender.com/oi0rimk). H Gating strategy used to identify peritoneal PKH26+ macrophages: Plots are representative for their respective group. I Boxplot showing the percentage of PKH26+ F4/80+ macrophages in Spleen, PF, and PM, 2 weeks after tumor cell injection without (−, n = 1 mouse) or with (+, n = 6 mice) PKH26 linker injection. Box: 25th to 75th percentiles; line: median; whiskers: minimum and maximum values. UMAP Uniform Manifold Approximation and Projection, CMs cavity macrophages, mono-CMs monocyte-like cavity macrophages, mono-macs monocyte-macrophage, Spl spleen, PF peritoneal fluid, PM peritoneal metastasis, HC healthy controls, PM-CRC peritoneal metastasized colorectal cancer, i.p. intraperitoneal. (ns = non-significant; *p ≤ 0.05; **p ≤ 0.01; ***p ≤ 0.001). All UMAPs in this figure were generated using only gene expression data. Source data are provided as a Source Data file.
Fig. 5
Fig. 5. Peritoneal-resident immunosuppressive macrophages contribute to the peritoneal metastatic TIME.
A Dot plots of selected genes encoding receptors of key macrophage chemoattractants. B Boxplot showing the normalized protein expression (NPX) levels using Olink technology in PF comparing HC (n = 5 donors) to PM-CRC patients (n = 12 patients). Line at median. Statistics: Mann–Whitney test, two-tailed. ***p = 0.0003; 0.0006; 0.0003. C Radarplot showing TAM median Ucell score signature per macrophage subset in PM. D Dot plots representing the 5 most differentially expressed TAM-associated genes per macrophage subset. Size represents percentage expressing cells and color represents the median gene expression. E Heatmap of bulk RNA-sequencing data (GSE190609) of paired patients’ primary tumor (PT), liver metastasis (LM), and peritoneal metastasis (PM) of colorectal cancer showing Z-score of immunosuppressive macrophage markers. F Paired patient analysis of gene set score in (E) (n = 12 patients with PT and PM, 6 patients also had LM). Statistics: paired t-test, two-tailed. *p = 0.026; 0.013. CMs cavity macrophages, mono-CMs monocyte-like cavity macrophages, mono-mac monocyte-macrophage, PM peritoneal metastasis, PT primary tumor, LM liver metastasis, HC healthy controls, PM-CRC peritoneal metastasized colorectal cancer, RTM resident-tissue macrophages, Angio pro-angiogenic, IFN interferon-primed, INFLAM inflammatory-cytokine enriched, LA lipid-associated, Prolif proliferating, Reg immune regulatory. (ns = non-significant; *p ≤ 0.05; ***p ≤ 0.001). Source data are provided as a Source Data file.
Fig. 6
Fig. 6. Improved overall survival in mice after macrophage-depleting therapy combined with immune checkpoint blockade.
A Gating strategy used to identify peritoneal macrophages: CD11b+F4/80+. Plots are representative for their respective group. B Quantification of flow cytometry data of % peritoneal macrophages out of myeloid cells in PMs after 21 days. Mice received control (n = 7 mice), anti-CSF1R (n = 5 mice), anti-PD1 (n = 4 mice) or anti-CSF1R/anti-PD1 combination therapy (n = 3 mice). Bar chart showing mean with SEM. Statistics: Kruskal–Wallis. *p = 0.027, 0.046 C IF of CD206+ macrophages in PM. D Quantification of CD206+ IF staining in PMs. Data shown as mean number of CD206+ cells per HPF with SEM. (control n = 5 mice; anti-CSF1R n = 5 mice; anti-PD1 n = 4 mice; anti-CSF1R/anti-PD1 n = 4 mice; minimally 3 high-power field (HPF) per mouse). Statistics: Kruskal–Wallis. *p = 0.038, **p = 0.005 E IF of CD8+ T cells in PM split per different treated groups. F Quantification of CD8+ IF staining in PM. Data shown as mean number of CD8+ cells per HPF with SEM. (control n = 5 mice; anti-CSF1R n = 5 mice; anti-PD1 n = 4 mice; anti-CSF1R/anti-PD1 n = 3 mice; minimally 3 HPF per mouse). Statistics: Kruskal–Wallis. G, H Subgroup analysis of mice that either reached their humane endpoint (control: n = 10 mice; anti-CSF1R: n = 6 mice; anti-PD1: n = 4 mice and anti-CSF1R/anti-PD1: n = 1 mouse) or were sacrificed after 21 days (anti-CSF1R/anti-PD1: n = 2 mice). Data shown as mean with SEM. Bar chart of ascites (G) Statistics (G): Fisher’s exact test. *p = 0.0016; 0.0035. Bar chart of mPCI (H). Statistics (H): Kruskal–Wallis. *p = 0.013. I Representative pictures of vehicle control (upper panel) and combination therapy (lower panel). J Schematic overview of in vivo experiments. Experiment 1: anti-CSF1R at t = 0 days. Experiment 2: anti-CSF1R at t = 7 days (Created in BioRender. Vermeulen, J. (2025) https://BioRender.com/hb9202t). K Survival analysis after 4 weeks (see J; exp 1). Statistics: Log-rank test. l Survival analysis after 6 weeks (see J; exp 2). Statistics: Log-rank test. M Stacked bar chart analysis showing proportion of mice achieving complete remission after 42 days. N Representative picture of combination therapy showing complete remission. Mφ macrophage, α anti, CFS1R colony stimulating factor 1 receptor, PD1 programmed cell death protein 1, HPF high-power field, PM peritoneal metastasis, mPCI modified peritoneal cancer index, CR clinical remission, i.p. intraperitoneal. Pre-clinical model: intraperitoneal injection of CT26 colorectal cancer cell line in BALB/c mice, followed by administration of anti-CSF1R and anti-PD1. (*p ≤ 0.05; **p ≤ 0.01). Source data are provided as a Source Data file.

Similar articles

Cited by

References

    1. Franko, J. et al. Prognosis of patients with peritoneal metastatic colorectal cancer given systemic therapy: an analysis of individual patient data from prospective randomised trials from the Analysis and Research in Cancers of the Digestive System (ARCAD) database. Lancet Oncol.17, 1709–1719 (2016). - PubMed
    1. Ploug, M., Graversen, M., Pfeiffer, P. & Mortensen, M. B. Bidirectional treatment of peritoneal metastasis with Pressurized IntraPeritoneal Aerosol Chemotherapy (PIPAC) and systemic chemotherapy: a systematic review. BMC Cancer20, 105 (2020). - PMC - PubMed
    1. Bijelic, L., Yan, T. D. & Sugarbaker, P. H. Failure analysis of recurrent disease following complete cytoreduction and perioperative intraperitoneal chemotherapy in patients with peritoneal carcinomatosis from colorectal cancer. Ann. Surg. Oncol.14, 2281–2288 (2007). - PubMed
    1. Hodi, F. S. et al. Improved survival with ipilimumab in patients with metastatic melanoma. N. Engl. J. Med.363, 711–723 (2010). - PMC - PubMed
    1. Cho, B. C. et al. Tiragolumab plus atezolizumab versus placebo plus atezolizumab as a first-line treatment for PD-L1-selected non-small-cell lung cancer (CITYSCAPE): primary and follow-up analyses of a randomised, double-blind, phase 2 study. Lancet Oncol.23, 781–792 (2022). - PubMed