. 2025 Apr 17;16(1):3657.
doi: 10.1038/s41467-025-58824-0.

The essential calcium channel of sperm CatSper is temperature-gated

Affiliations

The essential calcium channel of sperm CatSper is temperature-gated

Dilip K Swain et al. Nat Commun. .

Abstract

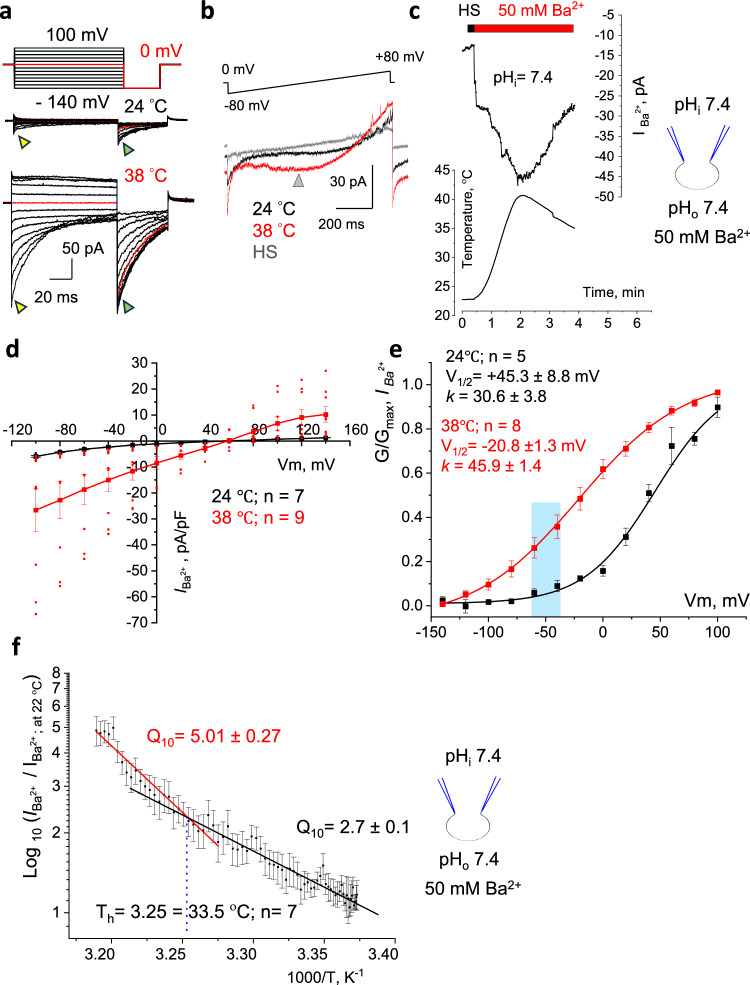
The flagellar calcium channel CatSper is essential for male fertility, as it regulates calcium influx to trigger the hyperactive motility required for sperm to fertilize the egg. Precise activation of CatSper is critical, as premature activation can impair sperm function. While optimal temperature is known to influence fertilization, its effect on CatSper remains unknown. By directly recording from mouse spermatozoa, we reveal that CatSper functions as a temperature-gated ion channel, with a thermal threshold of 33.5 °C and a temperature coefficient Q10 of 5.1. Additionally, we show that physiological levels of spermine reversibly inhibit CatSper's temperature gating, protecting against premature activation. Our findings highlight for the first time the presence of the temperature-gating modality of CatSper and reveal the protective role of spermine, a major component of seminal plasma. These results emphasize the need to maintain testes below 34 °C for optimal fertility and advance understanding of CatSper regulation in male fertility.


Conflict of interest statement

Competing interests: The authors have no competing interests.

Figures

Fig. 1
Fig. 1. Murine epididymal CatSper is activated by heat.
a Representative whole-cell patch clamp recordings from CatSper1+/+ murine sperm in response to indicated voltage steps at 24 °C (upper panel) and 38 °C (lower panel). Red traces indicate currents recorded at 0 mV. Triangles point to corresponding peak ICs+ amplitudes (yellow) and tail ICs+ amplitudes (green). b Representative recordings from CatSper1-/- sperm lacking ICs+ at indicated temperatures in response to similar voltage steps. c ICs+ in response to voltage ramps at 24 °C (black) and 38 °C (red), recorded from CatSper1+/+ (left panel) and CatSper1-/- (right panel) murine sperm. Insert shows mouse genotyping. Currents in the HS solution show baseline conductance. d Current-voltage relationships (I-V curves) were calculated from amplitudes shown on (a) as indicated by yellow triangles. Exposure to heat led to a significant increase in ICs+. P-values were as follows: 0.002 (at −140 mV), 0.0017 (at − 120 mV); 0.01 (at − 100 mV and −80 mV). e Murine ICs+ densities (mean values ± S.E.M.; pA/pF) from CatSper1+/+ sperm obtained at − 80 mV and + 80 mV at 24 °C, 28 °C, 32 °C, and 38 °C (n = 9), as well as the same cells’ ICs+ densities obtained after cooling (reversal). ICs+ densities obtained at − 80 mV were as follows: − 143.54 ± 11.86 (at 24 °C); − 162.20 ± 17.17 (at 28 °C); − 194.44 ± 19.54 (at 32 °C); and − 271.81 ± 19.97 (at 38 °C). Reversal ICs+ density at − 80 mV was − 134.79 ± 16.32; n = 3. ICs+ densities obtained at + 80 mV were as follows: 222.93 ± 13.16 (at 24 °C); 245.84 ± 16.31 (at 28 °C); 278.37 ± 17.66 (at 32 °C); and 340.85 ± 24.48 (at 32 °C). P-values for both outward and inward current densities were < 0.0001. f Time-course of ICs+ response (upper panel) to heat ramp (lower panel) recorded from CatSper1+/+ freshly isolated murine sperm was stable and reversible. g Conductance-membrane potential relationships (G-V curve) calculated from tail current amplitudes (green triangles; (a)) at 24 °C (black) and 38 °C (red) show midpoint activation shift (V1/2) from − 9.4 mV to − 85.5 mV; k indicates slope factor. The shaded blue area indicates the physiological range of membrane voltages for non-capacitated murine spermatozoa. Data are mean values ± S.E.M., n corresponds to the number of cells used. Insert shows the main conducting ion and pH of the solutions used for this figure.
Fig. 2
Fig. 2. Murine epididymal CatSper is a temperature-gated ion channel.
a Representative IBa2+ from CatSper1+/+ sperm in response to indicated voltage steps. Exposure to 38 °C led to a significant increase in IBa2+. Triangles point to corresponding peak IBa2+ amplitudes (yellow) and tail IBa2+ amplitudes (green). b Representative IBa2+ stimulated by a voltage ramp at 24 °C (black) and at 38 °C (red). A gray triangle indicates a timepoint corresponding to ~ −20 mV. c The heat response of IBa2+ recorded from wild-type sperm was stable and reversible. d I–V curves were calculated from peak amplitudes shown on (a), as pointed by yellow triangles. e G-V curves for IBa2+ were calculated from tail amplitudes shown on (a) as indicated by green triangles. The shaded blue area indicates the physiological range of membrane voltages for non-capacitated spermatozoa. f The current-temperature relationship was determined using IBa2+ amplitudes sampled at − 20 mV (gray triangle) and stimulated by temperature ramps from 24 °C to 41 °C. The linear fits of two phases of thermal response were used to determine Q10 and a thermal threshold (Th). Data are mean values ± S.E.M., n corresponds to the number of cells used. Inserts show the main conducting ions and pH of the solutions used.
Fig. 3
Fig. 3. Intracellular acidic pH protects murine CatSper from heat activation.
a Representative ICs+ recording in response to voltage steps at 24 °C (upper panel) to 38 °C (lower panel). Exposure to 38 °C led to a noticeable but fast-inactivating increase in the inward currents. b, c I–V curves were calculated from amplitudes shown on (a) at the peak (yellow triangles) or the steady state (blue triangles). d G-V curves were calculated from (a) tail current amplitudes (green triangles) at 22–24 °C and 38 °C. A non-significant midpoint activation shift (V1/2) from + 43.2 mV to + 24.6 mV was insufficient for CatSper activation. Slope factor k indicates shallow voltage dependence. e Representative heat response of ICs+ recorded from wild-type sperm kept at intracellular pH 6.0 is brief, inactivating, and reversible. f Two representative ICs+ recordings in response to indicated temperatures demonstrating variability in heat response. The baseline indicates ICs+ in HS solution. g ICs+ densities (mean values ± S.E.M; pA/pF) from murine sperm stimulated by a voltage ramp and sampled at −80 mV and + 80 mV, at 24 °C, 28 °C, 32 °C, and at 38 °C (n = 10). ICs+ densities obtained after the same cells were cooled down (reversal; n = 3) are also shown. Specifically, at − 80 mV ICs+ densities were: −48.42 ± 6.39 (at 24 °C); − 50.01 ± 6.37 (at 28 °C); − 58.48 ± 7.58 (at 32 °C); and − 78.56 ± 11.05 (at 38 °C). At + 80 mV ICs+ densities were: 123.89 ± 13.23 (at 24 °C); 134.47 ± 12.17 (at 28 °C); 154.24 ± 13.55 (at 32 °C); and 196.79 ± 16.17 (at 38 °C). Reversal ICs+ density was −55.54 ± 2.12 pA/pF (at − 80 mV). At −80 mV p = 0.0022 and at + 80 mV, p = 0.0002. Insert shows the main conducting ion and pH of the solutions used.
Fig. 4
Fig. 4. Spermine inhibits CatSper and protects it from temperature activation.
a Representative ICs+ recorded from wild-type spermatozoa in the presence of spermine in response to 22 °C (blue) and 38 °C (magenta). b Spermine inhibition is reversed with 0.25% heparin at 22 °C (green) and 38 °C (red). c Representative ICs+ in response to indicated voltage steps in the presence of spermine. Note the fast inactivation of the responses at 38 °C (right panel). Triangles point to corresponding ICs+ amplitudes at the steady state (blue) and tail ICs+ amplitudes (green). d Time-course of ICs+ reversible response (upper panel) to heat ramp (lower panel) recorded at + 80 mV (blue) and −80 mV (red) in the presence of 3 mM spermine. e Time-course of ICs+ reversible response after spermine was removed with 0.25 % heparin and stimulated by temperature ramp as in (c). Dotted areas show maximal CatSper activation upon heat exposure above 34 °C. The presence of spermine prevents inward ICs+ from reaching the same amplitude (d, e). Data are presented as mean values ± S.E.M., n corresponds to the number of cells used for (d, e). f G-V curves were calculated from ICs+ tail currents (c, green triangles) in the presence of spermine at 22 °C (blue) and 38 °C (magenta). For comparison, G-V curves in the absence of spermine at 22 °C (black) and 38 °C (red) are shown as dashed lines representing G-V curves from Fig. 1g. g I-V curves were calculated at the steady state in the presence of spermine (c, green triangles) at 22 °C (blue) and 38 °C (magenta). Dotted I-V curves show recordings in the absence of spermine, as in Supplementary Fig. S3g. h Spermine exposure (purple) but not acidic pH (brown) significantly shifted ICs+ midpoint activation upon heat. However, the spermine-induced shift resulted in V1/2 change from − 3.7 mV to only − 25.3 mV, which is still outside of the physiological range of membrane voltages for non-capacitated spermatozoa, as shown by the dotted and shaded area. The shift of V1/2 upon heat for nonexposed control spermatozoa recorded with normal (pH = 7.4) pH (black) is shown for comparison. Data are presented as mean values ± S.E.M., n corresponds to the number of cells used. Data are cumulative from Figs. 1g, 3d, and 4f. P-values were as follows: 0.001 (spermine; magenta) and 0.0013 (control; black).
Fig. 5
Fig. 5. Sperm capacitation reduces CatSper’s response to heat.
a Representative ICs+ from wild-type capacitated sperm at 24 °C (black) and 38 °C (red) in response to voltage ramp. The baseline indicates the HS solution. b Representative ICs+ from capacitated sperm in response to indicated voltage steps. Exposure to heat increased ICs+. c I–V curves calculated from amplitudes shown on (b, yellow triangles). Exposure to 38 °C led to a noticeable increase in ICs+. Insert shows the main conducting ion and pH of the solutions used in (ac). d Representative IBa2+ from capacitated sperm at 24 °C (black) and 38 °C (red) in response to a voltage ramp. e Representative IBa2+ from capacitated sperm in response to indicated voltage steps. f I–V curves were calculated from amplitudes shown on (e, yellow triangles). Unlike ICs+, exposure to 38 °C led to only a minimal increase in IBa2+, due to fast inactivation of the responses. Insert shows the main conducting ion and pH of the solutions used in (df). g Capacitated spermatozoa show larger capacitance (Cm) for ICs+: Cmnon-capacitated = 2.45 ± 0.01 pF, n = 109, vs Cmcapacitated = 2.77 ± 0.09 pF, n = 51. h Capacitated spermatozoa also showed increased Cm for IBa2+: Cmnon-capacitated = 2.53 ± 0.04 pF, n = 29, vs Cmcapacitated = 2.97 ± 0.03 pF, n = 42. P-values were 0.0001 for both (g and h). i G-V curve calculated from tail amplitudes (b, green triangles) at 24 °C (black) and 38 °C (red) shows a reduced leftward shift. P-values were 0.015 (at − 80 mV), 0.04 (at − 60mV), and 0.001 (at − 40mV). j G-V curves for IBa2+ were calculated from tail amplitudes shown on (e, green triangles) at 24 °C (black) and 38 °C (red). Insert shown on (c) refers to the main conducting ion and pH of the solutions used in (ag), and (i), while the insert shown on (f) refers to the same parameters used in (d)-(f), (h) and (j). Data are mean values ± S.E.M., n corresponds to the number of cells used. Sperm cells analyzed for this data set were subjected to 45 min of capacitation.
Fig. 6
Fig. 6. Other temperature-gated channels in murine sperm do not influence CatSper temperature-gating.
a TRPV4, TRPM3, and TRPM4 are present in murine sperm transcriptome. mRNA sequencing (mRNA-Seq) reads from purified caudal epididymal murine sperm cells and peripheral blood leukocytes (Pbl). Fpkm, fragments per kilobase of transcript per million mapped reads. The dotted line shows the expected number of sequence reads for genes with similar expression levels in the sperm cells and Pbl. CatSper1 and CatSper2 indicate sperm-specific transcripts; TRPV2 and CD37 indicate leukocyte-specific transcripts. Transcripts for TRPV4, TRPM3, and TRPM4 are shown. Raw and processed data can be downloaded from NCBI; with GEO accession number GSE290696. b Table shows expression levels of corresponding transcripts. c Representative ICs+ from TRPV4+/+ murine sperm (left) show similar potentiation in response to indicated temperatures as ICs+ from TRPV4-/- murine sperm (right). The baseline corresponds to currents in the HS solution. d ICs+ densities obtained from voltage ramp recordings shown in (c) at either 22 °C or 38 °C were independent of the genotype. Thus, TRPV4 is unlikely to affect murine CatSper temperature activation. Specifically, at − 80 mV, current densities (pA/pF; n = 6) were: − 92.05 ± 9.9 (at 24 °C) and -239.95 ± 18.8 (at 38 °C) for TRPV4-/- sperm cells. ICs+ densities (pA/pF; n = 7) at − 80 mV for wild-type sperm cells were -58.05 ± 5.8 (at 24°C) and -183.07 ± 30.8 (at 38 °C). Similarly, ICs+ densities at + 80 mV (pA/pF; n = 6) for TRPV4-/- cells were 147.84 ± 7.3 (at 24 °C) and 254.13 ± 14.1 (at 38 °C). For wild-type cells at + 80 mV, ICs+ densities (pA/pF; n = 7) were 175.27 ± 12.4 (at 24 °C) and 298.77 ± 17.8 (at 38 °C). Data are mean values ± S.E.M. Insert: Mouse genotyping is shown. e Representative non-CatSper conductance obtained in response to voltage ramps in ICatSper blocking Mg2+-containing medium in the presence of either pregnenolone sulfate (PS; TRPM3 agonist, red) or primidone (TRPM3 antagonist) plus PS (green). No change in response to the exposure of either PS or PS + primidone was observed. f Representative non-CatSper conductance obtained in response to voltage ramps in ICatSper blocking Mg2+-containing medium in the presence of capsaicin (TRPV1 agonist, blue). No appearance of the additional conductance was observed. g Non-CatSper monovalent (sodium) current densities (pA/pF) obtained as described in (e) and (f) and sampled at −80 mV and +80 mV. Specifically, at − 80 mV, current densities (pA/pF) were as follows: − 2.1 ± 0.2 (HS; n = 9); -2.9 ± 0.7 (control, n = 9); − 1.9 ± 0.1 (PS; n = 6); -2.0 ± 0.3 (PS + primidone, n = 6), and -3.3 ± 1.1 (capsaicin, n = 3). At + 80 mV, current densities (pA/pF) were as follows: 4.8 ± 0.4 (HS; n = 9); 13.0 ± 2.3 (control, n = 9); 9.4 ± 0.6 (PS; n = 6); 8.3 ± 0.8 (PS + primidone, n = 6), and 10.9 ± 1.8 (capsaicin, n = 3). Data are mean values ± S.E.M.
Fig. 7
Fig. 7. Sperm exposure and adaptation to variable environments.
a Cartoon demonstrates spermatozoon’s journey through male and female reproductive tracts and the diverse environments it encounters, including pH, spermine, and temperature gradients. Created in BioRender. Lishko, P. (2025) https://BioRender.com/z91g452. b Phylogenetic tree shows species in which CatSper is present (mammals; solid boxes) and in which CatSper is absent (birds; dotted box). Averaged testicular temperatures are indicated, as well as internal (Int) vs external (Ext) testes. Corvus corone – Carrion crow; Gallus gallus- Red junglefowl (chicken); Tenrec ecaudatus- Tailless tenrec; Homo sapiens- human; Mus musculus- house mouse; Phoca vitulina – Harbor seal; Delphinus delphis – short-beaked common dolphin; Bos taurus – common cow; Sus scrofa- wild boar.

References

    1. Austin, C. R. Observations on the penetration of the sperm in the mammalian egg. Aust. J. Sci. Res. B4, 581–596 (1951). - PubMed
    1. Chang, M. C. Fertilizing capacity of spermatozoa deposited into the fallopian tubes. Nature168, 697–698 (1951). - PubMed
    1. Suarez, S. S., Varosi, S. M. & Dai, X. Intracellular calcium increases with hyperactivation in intact, moving hamster sperm and oscillates with the flagellar beat cycle. Proc. Natl. Acad. Sci. USA90, 4660–4664 (1993). - PMC - PubMed
    1. Chan, P. J., Corselli, J. U., Patton, W. C., Jacobson, J. D. & King, A. Heat-induced hyperactivation. J. Assist. Reprod. Genet.15, 32–38 (1998). - PMC - PubMed
    1. Suarez, S. S. Control of hyperactivation in sperm. Hum. Reprod. Update14, 647–657 (2008). - PubMed

LinkOut - more resources