. 2025 Apr 17;11(1):36.
doi: 10.1038/s41540-025-00508-y.

Exploring the role of EMT in ovarian cancer progression using a multiscale mathematical model

Affiliations

Exploring the role of EMT in ovarian cancer progression using a multiscale mathematical model

Samuel Oliver et al. NPJ Syst Biol Appl. .

Abstract

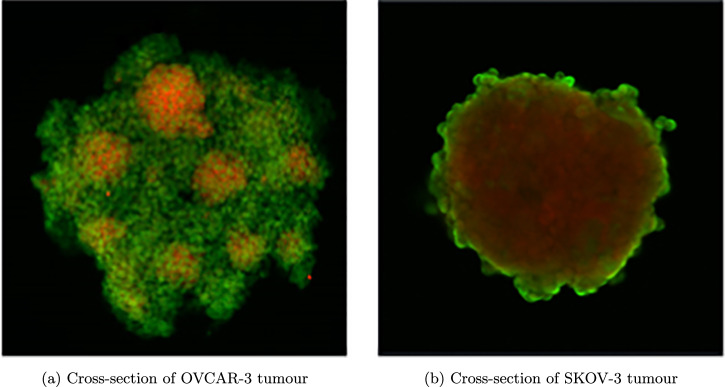
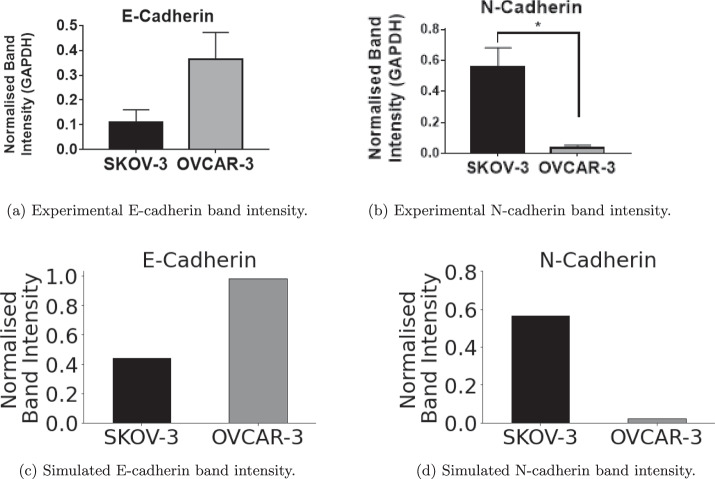
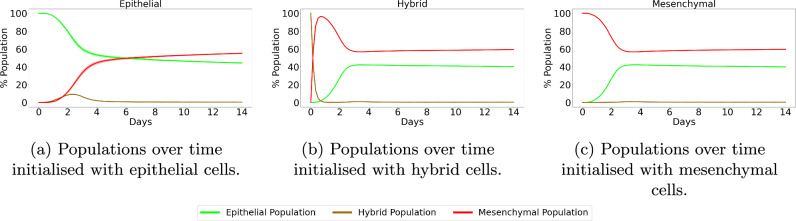
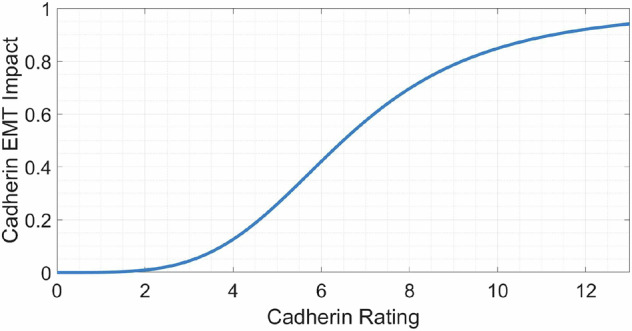
Epithelial-to-mesenchymal transition (EMT) plays a key role in the progression of cancer tumours, significantly reducing the success of treatment. EMT occurs when a cell undergoes phenotypical changes, resulting in enhanced drug resistance, higher cell plasticity, and increased metastatic abilities. Here, we employ a 3D agent-based multiscale modelling framework using PhysiCell to explore the role of EMT over time in two cell lines, OVCAR-3 and SKOV-3. This approach allows us to investigate the spatiotemporal progression of ovarian cancer and the impacts of the conditions in the microenvironment. OVCAR-3 and SKOV-3 cell lines possess highly contrasting tumour layouts, allowing a wide range of different tumour dynamics and morphologies to be tested and studied. Along with performing sensitivity analysis on the model, simulation results capture the biological observations and trends seen in tumour growth and development, thus helping to obtain further insights into OVCAR-3 and SKOV-3 cell line dynamics.


Conflict of interest statement

Competing interests: Authors S.O., M.W., and D.G. declare no financial or non-financial competing interests. Author M.K.J. serves as Editor-in-Chief of this journal and had no role in the peer-review or decision to publish this manuscript. Author G.P. serves as an Editorial Board Member of this journal and had no role in the peer-review or decision to publish this manuscript. Authors M.K.J. and G.P. declare no financial competing interests.

Figures

Fig. 1
Fig. 1. Cross-section of tumours upon biological experiment completion.
Green areas represent high levels of E-cadherin, expressed in epithelial cells. Red areas show high expression of N-cadherin, a marker for mesenchymal cells. a Small clumps of mesenchymal cells are shown in OVCAR-3 tumours surrounded by a backdrop of epithelial cells. b Mesenchymal cells make up the majority of SKOV-3 tumours, with a thin layer of epithelial cells appearing on the periphery. Details on the experimental conditions can be found in Section “Experimental Methods”.
Fig. 2
Fig. 2. Appearance of cells during the simulations based on their current N-cadherin rating.
Cells can take fourteen different values, with ratings 0-6 classified as epithelial and 7-13 classified as mesenchymal. There is an average rating of three for epithelial cells and ten for mesenchymal cells. The colour of each cell during the simulations represents where along this scale they are placed.
Fig. 3
Fig. 3. Cross-section of an example tumour at time t = 0.
1027 cells are randomly placed within a sphere of radius 120 microns around the centre of the domain. Snapshots such as this show a z = 0 cross-section of the spheroid at the respective time of the simulation, with the colour of the cells showing the current N-cadherin rating ranging between green (epithelial) to red (mesenchymal).
Fig. 4
Fig. 4. Simulated OVCAR-3 tumour at different time points using default parameter values.
The initial placement of OVCAR-3 cells for the simulation is shown in (a). Cells after one day (b) and two days (c) show that initially, very small amounts of EMT occur in the first 48 h. Due to the bystander effect, clumps appear rapidly towards the latter simulation times, as shown after three days (d) and four days (e), in which small red mesenchymal clumps begin to form. Population types are shown in (f), with epithelial (green) and mesenchymal (red) tumour proportions over time with 95% confidence intervals.
Fig. 5
Fig. 5. Conditions of cells with respect to the position in the tumour.
Each black dot in the subfigures represents a cell at the final simulation time point. a shows how the trends in the dimensionless pressure on the cells are affected by the distance of the cell from the centre of the tumour. Using a trial simulation initialized with a tumour of OVCAR-3 cells, results show a general negative trend between the radius from the centre of the tumour and the pressure on a cell. Pressure is generally lowest for cells at high radii, suggesting those on the tumour surface are under lower pressure from the neighbouring cells. b shows a clear positive trend between surrounding oxygen levels for a cell and the radius of the cell from the centre of the tumour, confirming those cells on the surface of the tumour have access to more oxygen than those in the interior.
Fig. 6
Fig. 6. Simulated SKOV-3 tumour at different time points using default parameter values.
The initial placement of SKOV-3 cells for the simulation is shown in (a). After only one day (b), high levels of EMT have already occurred throughout the tumour, with completed EMT observed in almost all interior cells after two days (c). A red mesenchymal pool forms inside the tumour after three days (d) and four days (e) with a green epithelial layer created around the periphery. Population types are shown in (f), with epithelial (green) and mesenchymal (red) tumour proportions over time with 95% confidence intervals.
Fig. 7
Fig. 7. Band intensity of E-cadherin and N-cadherin for the in-vitro and in-silico experiments.
Results after 96 h from the in-vitro biological experiments show the normalized band intensities of E-cadherin (a), a marker for epithelial cells, and N-cadherin (b), a marker for mesenchymal cells. These are compared with in-silico results taken after 96 h of simulated time. Proportions of cells classified as epithelial (E-cadherin) and mesenchymal (N-cadherin) for both cell lines are recorded, shown in (c) and (d) respectively.
Fig. 8
Fig. 8. Classification of N-cadherin ratings when hybrid cells are included in the model.
When including MET, a hybrid state is introduced into the classification of cells. Cells rated 0-4 are now classified as epithelial, 5-8 as hybrid, and 9-13 as mesenchymal. This ternary classification allows for more detailed results and easier comparisons with past models as shown in Sections “OVCAR-3 with MET” and “SKOV-3 with MET”.
Fig. 9
Fig. 9. OVCAR-3 tumour over four days of simulated time, initialized with epithelial cells.
The initial placement of OVCAR-3 cells with an N-cadherin rating of zero is shown in (a). Minimal EMT occurs in the first day (b), with only very faint areas of darker green cells appearing after two days (c), suggesting very little EMT has occurred at this point. The amount of EMT undergone after three days (d) and four days (e) remains negligible, with all cells remaining purely epithelial over time.
Fig. 10
Fig. 10. OVCAR-3 tumour over four days of simulated time, initialized with hybrid cells.
The initial placement of OVCAR-3 cells with an N-cadherin rating of seven is shown in (a). After one day (b), the tumour is made of a mixture of epithelial, hybrid, and mesenchymal cells, each scattered what appears to be at random throughout the tumour, with similar observations seen after two days (c). After three days (d), small collections of epithelial cells can be observed in among the scattering of individual epithelial, hybrid, and mesenchymal cells, seen further after four days (e).
Fig. 11
Fig. 11. OVCAR-3 tumour over four days of simulated time, initialized with mesenchymal cells.
The initial placement of OVCAR-3 cells with an N-cadherin rating of thirteen is shown in (a). Minimal MET occurs in the first day (b), with areas of green epithelial cells appearing after two days (c). This patch of epithelial cells in the bottom right section of the tumour continues to grow after three days (d) with areas of epithelial cells observed throughout the tumour after four days (e), despite the vast majority of cells remaining mesenchymal during the simulation.
Fig. 12
Fig. 12. Epithelial vs hybrid vs mesenchymal OVCAR-3 cell populations found in-silico including MET.
SKOV-3 tumours are initialized with epithelial (a), hybrid (b), or mesenchymal (c) cells. Simulations are run for 96 h with the cellular proportions of the OVCAR-3 tumour composition recorded every hour. Curves show the populations of epithelial (green), hybrid (brown), and mesenchymal (red) cells during the simulation. Confidence intervals of 95% are present in each plot, taken from ten repeats of the simulation. However, due to the lack of substantial stochastically in the model, these intervals are not visible in the plots.
Fig. 13
Fig. 13. Epithelial vs hybrid vs mesenchymal cells populations found by Tripathi et al..
Each panel shows the cell population of the cell types over time for both an in-vitro experiment performed by Ruscetti et al. (dotted curves) and in-silico simulation results of a model designed by Tripathi et al. (solid curves). Epithelial (E), hybrid, and mesenchymal (M) cell populations are shown using green, orange, and purple curves respectively. Cells initialized with either epithelial (a) or mesenchymal (c) cells generally remain with the respective cell type as the majority of the tumour at the final time of the simulation. Tumours initialized with a hybrid population (b) show lower stability, with cells rapidly transforming into either mesenchymal or epithelial cells.
Fig. 14
Fig. 14. SKOV-3 tumour over four days of simulated time, initialized with epithelial cells.
Epithelial SKOV-3 cells are placed in the domain with an N-cadherin rating of zero (a). After one day, the majority of the tumour has undergone full EMT (b), showing a large area of red mesenchymal cells within the tumour. All interior cells complete EMT within two days (c), with occasional cells around the periphery converting back to epithelial cells as a result of high oxygen levels. This epithelial shell becomes more prominent after three days (d) and four days (e), where the outer layer of epithelial cells surrounds the interior pool of mesenchymal cells.
Fig. 15
Fig. 15. Epithelial vs hybrid vs mesenchymal SKOV-3 cell populations found in-silico including MET.
SKOV-3 tumours are initialized with epithelial (a), hybrid (b), or mesenchymal (c) cells. Simulations are run for fourteen days with the cellular proportions of the SKOV-3 tumour composition recorded every hour. Curves show the populations of epithelial (green), hybrid (brown), and mesenchymal (red) cells during the simulation. Confidence intervals of 95% are present in each plot, taken from ten repeats of the simulation. However, due to the lack of substantial stochastically in the model, these intervals are not visible in the plots.
Fig. 16
Fig. 16. Dependence of cell cycling parameter values on cell conditions.
Increased N-cadherin rating (a) and pressure a cell is under from neighbouring cells (b) decrease the cell cycling rate, while increased oxygen concentration (c) increases the cell cycling rate. Hill functions range between a maximum of two to a minimum of one.
Fig. 17
Fig. 17. Dependence of different cell variables on the current N-cadherin rating of the cell.
Increased N-cadherin ratings increase cell migration (a) and bystander signal secretion rate (b) while decreasing cell-cell adhesion strength (c).
Fig. 18
Fig. 18. Dependence of the EMT rate parameters on the microenvironment.
Increased oxygen concentration reduces the probability of EMT occurring in a cell (a) due to the lack of hypoxic conditions that encourage EMT. To create the bystander effect, an increased concentration of signal around a cell increases the rate of EMT (b). This ensures epithelial cells in the presence of signal-secreting mesenchymal cells are more likely to undergo EMT and form mesenchymal clumps within the tumour.
Fig. 19
Fig. 19. Cadherin EMT impact parameter, ce*, vs current N-cadherin rating.
This shows how the current N-cadherin rating of a cell affects the likelihood of further steps up the N-cadherin rating. This positive correlation leads to increased stability in rating at either end of the EMT scale, as epithelial cells are less likely to undergo EMT on each iteration of the simulation than mesenchymal cells that are in otherwise identical conditions.

Similar articles

References

    1. Tiwari, N., Gheldof, A., Tatari, M. & Christofori, G. Emt as the ultimate survival mechanism of cancer cells. In Seminars in cancer biology, vol. 22, 194–207 (Elsevier, 2012). - PubMed
    1. Felipe Lima, J., Nofech-Mozes, S., Bayani, J. & Bartlett, J. M. Emt in breast carcinoma—a review. J. Clin. Med.5, 65 (2016). - PMC - PubMed
    1. Lambert, A. W. & Weinberg, R. A. Linking emt programmes to normal and neoplastic epithelial stem cells. Nat. Rev. Cancer21, 325–338 (2021). - PubMed
    1. Kerosuo, L. & Bronner-Fraser, M. What is bad in cancer is good in the embryo: importance of EMT in neural crest development. In Seminars in cell & developmental biology, vol. 23, 320–332 (Elsevier, 2012). - PMC - PubMed
    1. Moustakas, A. & Heldin, C.-H. Signaling networks guiding epithelial–mesenchymal transitions during embryogenesis and cancer progression. Cancer Sci.98, 1512–1520 (2007). - PMC - PubMed

LinkOut - more resources