. 2025 Sep;21(9):1408-1419.
doi: 10.1038/s41589-025-01886-4. Epub 2025 Apr 17.

Induced proximity to PML protects TDP-43 from aggregation via SUMO-ubiquitin networks

Affiliations

Induced proximity to PML protects TDP-43 from aggregation via SUMO-ubiquitin networks

Kristina Wagner et al. Nat Chem Biol. 2025 Sep.

Abstract

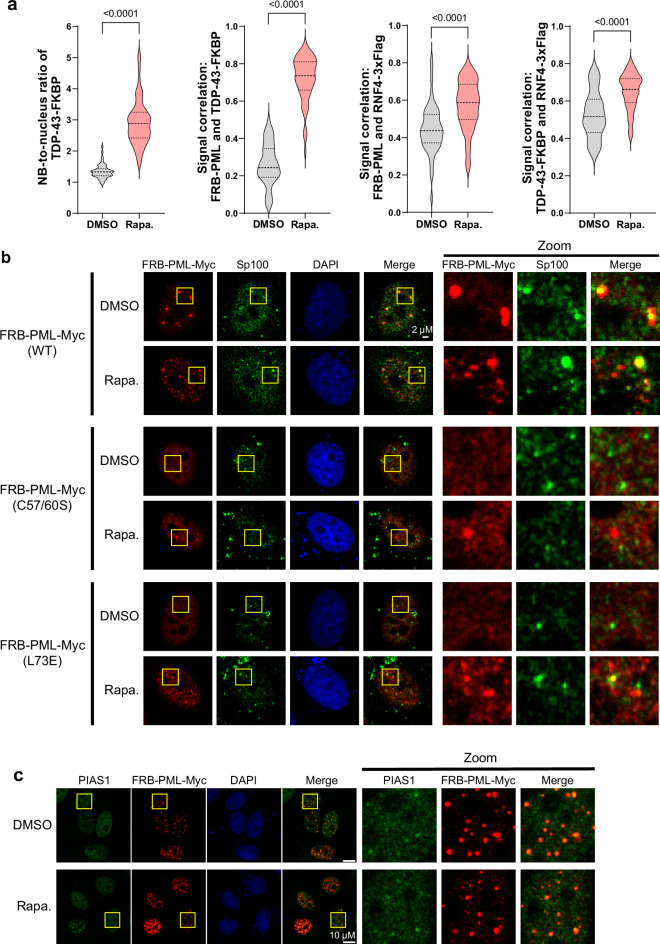
The established role of cytosolic and nuclear inclusions of TDP-43 in the pathogenesis of neurodegenerative disorders has multiplied efforts to understand mechanisms that control TDP-43 aggregation and has spurred searches for approaches limiting this process. Formation and clearance of TDP-43 aggregates are controlled by an intricate interplay of cellular proteostasis systems that involve post-translational modifications and frequently rely on spatial control. We demonstrate that attachment of the ubiquitin-like SUMO2 modifier compartmentalizes TDP-43 in promyelocytic leukemia protein (PML) nuclear bodies and limits the aggregation of TDP-43 in response to proteotoxic stress. Exploiting this pathway through proximity-inducing recruitment of TDP-43 to PML triggers a SUMOylation-ubiquitylation cascade protecting TDP-43 from stress-induced insolubility. The protective function of PML is mediated by ubiquitylation in conjunction with the p97 disaggregase. Altogether, we demonstrate that SUMO-ubiquitin networks protect cells from insoluble TDP-43 inclusions and propose the functionalization of PML as a potential future therapeutic avenue countering aggregation.


Conflict of interest statement

Competing interests: E.W. and B.A. have filed a patent on the rapamycin-induced recruitment system used in this work (EP23173977.2). The other authors declare no competing interests. Inclusion and ethics statement: All authors of this study have fulfilled the criteria for authorship required by Nature Portfolio journals.

Figures

Fig. 1
Fig. 1. Attachment of SUMO2 protects TDP-43 from stress-induced aggregation.
a, Schematic representation of the solubility assay. HEK293T cells transiently expressing Flag-TDP-43, Flag-SUMO2–TDP-43 or Flag-4×SUMO2–TDP-43 were lysed in an NP-40-containing lysis buffer. Before lysis, cells were exposed to HS (43 °C, 1 h), SA (0.5 mM, 1 h) or left untreated. Lysates were fractionated into an NP-40-insoluble pellet and an NP-40-soluble supernatant fraction and analyzed by western blotting. Panel a is created with BioRender.com. b, Solubility assay. HEK293T cells expressing Flag-TDP-43, Flag-SUMO2–TDP-43 or Flag-4×SUMO2–TDP-43 for 48 h were treated with SA (0.5 mM, 1 h) or left untreated before lysis and fractionation (as described in a). NP-40-soluble/NP-40-insoluble fractions are indicated by green and red bars. Statistical analysis of three independent replicates is provided in Extended Data Fig. 1a. c, As in b, but cells were subjected to HS (43 °C, 1 h) or left untreated. Statistical analysis of three independent replicates is provided in Extended Data Fig. 1a. d, As in b and c, but cells were additionally treated with MG132 (10 µm, 4 h) or DMSO. Statistical analysis of three independent replicates is provided in Extended Data Fig. 1c. e, As in bd, but cells were treated with DBeQ (20 µm, 4 h) or DMSO. Statistical analysis of three independent replicates is provided in Extended Data Fig. 1d. HS, heat stress; SA, sodium arsenite. Source data
Fig. 2
Fig. 2. SUMO2-modified TDP-43 is associated with PML NBs.
a, Volcano plot displaying the results of IP-MS in HEK293T cells expressing Flag-4×SUMO2–TDP-43 or Flag-TDP-43. The difference in the log2 mean LFQ intensities between IPs from Flag-4×SUMO2–TDP-43 and Flag-TDP-43 expressing cells was plotted against the negative logarithmized P values of a two-sided Student’s t test (n = 3). Proteins significantly enriched in IPs from cells expressing Flag-4×SUMO2–TDP-43 (log2(4×SUMO2–TDP-43/TDP-43) > 1 and P < 0.05) are highlighted in red. TDP-43 and proteins associated with PML NBs are indicated. b, GOCC enrichment analysis of proteins interacting with Flag-4×SUMO2–TDP-43. Proteins that were exclusively identified in all three replicates of IPs from Flag-4×SUMO2–TDP-43 expressing cells and proteins that were significantly enriched in IPs from Flag-4×SUMO2–TDP-43 expressing cells (versus Flag-TDP-43) were combined into a dataset and used for GOCC enrichment analysis. Greater than fivefold enriched GOCC terms are shown. c, STRING cluster of proteins that were significantly enriched in a and are associated with the GOCC term ‘PML body’. d, HEK293T cells were transfected with Flag-4×SUMO2–TDP-43, Flag-SUMO2–TDP-43, Flag-TDP-43 or an empty vector. Flag-IP was performed to enrich TDP-43 variants and interacting proteins. Coprecipitated PML, Daxx and RNF4 were detected. e, Endogenous TDP-43 was immunoprecipitated from HEK293T cell lysates, and coprecipitation of PML was detected. Two major isoforms of PML are detected. f, HEK293T cells were transfected with Myc-tagged PML (WT or SIMmut) in combination with Flag-TDP-43 (WT, 1×SUMO, 4×SUMO) or an empty vector. TDP-43 was enriched by Flag-IP, and co-immunoprecipitated PML variants were detected. g, Enrichment of ubiquitylated Flag-4×SUMO2–TDP-43 by Ni-NTA pull down. HEK293T cells were depleted of RNF4 and Topors by siRNA. Subsequently, cells were transfected with His-Ub and Flag-4×SUMO2–TDP-43 and exposed to HS (43 °C, 1 h) or left untreated. Ubiquitylated proteins were enriched by denaturing Ni-NTA pull down. Signal intensities of high-molecular-weight bands (running above the height of unmodified Flag-4×SUMO2–TDP-43) in pull-down samples (anti-Flag) were quantified and normalized to the matching input intensities. Source data
Fig. 3
Fig. 3. Recruitment to PML enhances SUMOylation of TDP-43.
a, Model of the rapamycin-induced recruitment of PML to TDP-43. FKBP was fused to the C terminus of HA–TDP-43, and FRB was fused to the N terminus of PML–Myc. Upon addition of rapamycin, HA–TDP-43–FKBP is recruited into a ternary complex with FRB–PML–Myc and rapamycin. Panel a is created with BioRender.com. b, HA-IP was performed in HEK293T cells expressing FRB–PML–Myc and HA–TDP-43–FKBP for 48 h. Cells were mock-treated or treated with rapamycin (100 nM, 4 h). c, HeLa cells expressing endogenously tagged RNF4-3×Flag were transfected with FRB–PML–Myc and HA–TDP-43–FKBP for 24 h and either mock-treated or treated with rapamycin (100 nM, 3 h). Inset areas are indicated with yellow squares. Scale bar = 5 µm. Statistical analysis is provided in Extended Data Fig. 3a. d, Enrichment of SUMOylated HA–TDP-43–FKBP by Ni-NTA pull down. HEK293T cells were transfected with His-SUMO2 together with FRB–PML–Myc and HA–TDP-43–FKBP for 48 h and were treated with HS (43 °C, 1 h), SA (0.5 mM, 1 h) or left untreated. Rapamycin was added where indicated (100 nM, 4 h). SUMOylated proteins were enriched by denaturing Ni-NTA pull down. e, As in d, but cells were left untreated. HEK293T cells were transfected with FRB–PML–Myc (WT, C57,60S or L73E) together with HA–TDP-43–FKBP and His-SUMO2. Signal intensities of high-molecular-weight bands (running above the height of unmodified HA–TDP-43–FKBP) in pull-down samples (anti-HA) were quantified and normalized to the respective intensities in the matching input lane. Relative values are listed below the top right panel. f, HeLa cells expressing TDP-43–FKBP–HA from the endogenous TDP-43 locus together with FRB–PML–Myc were treated with DMSO or 100 nM rapamycin for 4 h. TDP-43–FKBP–HA was enriched by HA-IP under denaturing conditions and immunoblotted for SUMO2/SUMO3 conjugates. g, U2OS WT and PML-KO cells were subjected to 1 h of HS at 43 °C or left untreated. SUMOylated proteins were enriched by IP. Rapa., rapamycin; KO, knockout. Source data
Fig. 4
Fig. 4. Recruitment to PML enhances ubiquitylation of TDP-43.
a, Enrichment of ubiquitylated HA–TDP-43–FKBP by Ni-NTA pull down. As shown in Fig. 3d, but His-Ub was transfected together with FRB–PML–Myc and HA–TDP-43–FKBP. b, Enrichment of ubiquitylated HA–TDP-43–FKBP by Ni-NTA pull down in HEK293T cells expressing either WT or mutant (C57, 60S, L73E) FRB–PML–Myc together with HA–TDP-43–FKLBP and His-Ub. Signal intensities of high-molecular-weight bands (running above unmodified HA–TDP-43–FKBP) in pull-down samples (anti-HA) were quantified and normalized to the respective input intensities. Relative values are listed. c, Enrichment of ubiquitylated HA–TDP-43–FKBP by Ni-NTA pull down. HEK293T cells were transfected with His-Ub together with FRB–PML–Myc and HA–TDP-43–FKBP for 48 h and mock-treated or treated with TAK-981 (500 nM, 4 h). Rapamycin was added where indicated (100 nM, 4 h). Quantification was done as described in b. d, Enrichment of SUMO/Ub comodified HA–TDP-43–FKBP by HA-IP under denaturing conditions followed by Ni-NTA-pull down after HS (43 °C, 1 h). HEK293T cells were transfected with FRB–PML–Myc and HA–TDP-43–FKBP together with either His-Ub or an empty vector (e.v.). Rapamycin was added where indicated (100 nM, 4 h). HA–TDP-43–FKBP was enriched by HA-IP followed by denaturing Ni-NTA pull down of precipitated proteins. e, HEK293T cells were transfected with FRB–PML–Myc and HA–TDP-43–FKBP and treated with 100 nM rapamycin or DMSO for 4 h. TDP-43–FKBP was enriched by a denaturing HA-IP, and the ubiquitylation of TDP-43–FKBP was monitored with a pan-Ub or Ub-chain-specific (K48, K63) antibodies. f, Enrichment of ubiquitylated HA–TDP-43–FKBP by Ni-NTA pull down. HEK293T cells depleted of RNF4, Topors or both by siRNA or transfected with a nontargeting control siRNA followed by transfection with His-Ub, FRB–PML–Myc and HA–TDP-43–FKBP. Before lysis, cells were treated with rapamycin (100 nM, 4 h) or DMSO. Quantification was done as described in b. g, Enrichment of SUMOylated HA–TDP-43–FKBP by Ni-NTA pull down. As in f, but His-SUMO2 was transfected instead of His-Ub. Quantification was done as described in b. Source data
Fig. 5
Fig. 5. Recruitment to PML limits the aggregation of TDP-43.
a, Top, solubility assay. HEK293T cells were transfected as indicated for 48 h, exposed to HS (43 °C, 1 h) or left untreated. Where indicated, rapamycin was added (100 nM, 4 h). Bottom, unfractionated lysates. Statistical analysis is provided in Extended Data Fig. 6a (n = 3). b, Left, solubility assay as in a, but cells were treated with MG132 (25 µm, 4 h). Right, unfractionated lysates. Statistical analysis is provided in Extended Data Fig. 6b (n = 3). c, Left, solubility assay as in a and b, but cells were treated with DBeQ (20 µm, 4 h). Right, unfractionated lysates. Statistical analysis is provided in Extended Data Fig. 6c (HS, n = 5; SA, n = 4). d, Left, immunofluorescence images of pre-extracted HeLa cells transfected with FRB–PML–Myc and HA–TDP-43–FKBP. Treatment with rapamycin (100 nM, 4 h), DMSO and SA (0.5 mM, 1 h) where indicated. Scale bar, 5 µm. Right, VCP/FRB-signal ratio in PML NBs was determined per cell. At least 71 cells per condition were measured. P values of two-tailed, unpaired Student’s t tests are indicated. e, Left, solubility assay as in ac, but cells were expressing ALS-associated TDP-43 variants as indicated. Right, unfractionated lysates. Statistical analysis is provided in Extended Data Fig. 6d (n = 3). f, Solubility assay in engineered HeLa cells expressing TDP-43–FKBP–HA from the endogenous TDP-43 locus together with FRB–PML–Myc. Treatments—rapamycin (100 nM, 4 h), HS (43 °C, 1 h) and SA (0.5 mM, 1 h). Statistical analysis is provided in Extended Data Fig. 6e (n = 3). g, Left, solubility assay as in f, but where indicated cells were treated with TAK-243 (10 µm, 4 h). Right, unfractionated lysates. Statistical analysis is provided in Extended Data Fig. 7a (n = 3). h, Fluorescence microscopy. mRuby3–PML and mClover3–TDP-43 expression from a lentiviral expression cassette (HeLa) was induced by doxycycline (1 µg ml−1, 24 h). Colocalizing and noncolocalizing foci of mRuby3–PML and mClover3–TDP-43 are indicated by yellow and white circles, respectively. Scale bar, 2 µm. Statistical analysis is provided in Extended Data Fig. 7b. i, Solubility assay as in a, but in HEK293T cells expressing FRB–Sp100–Myc (instead of FRB–PML–Myc) and HA–TDP-43–FKBP for 48 h. Statistical analysis is provided in Extended Data Fig. 8c (n = 3). Untr., untreated. Source data
Fig. 6
Fig. 6. Model.
Model depicting the interconnection of StUbL signaling and PML NBs with cytosolic SGs in proteostasis of TDP-43. The figure is created with BioRender.com.
Extended Data Fig. 1
Extended Data Fig. 1. Attachment of SUMO2 protects TDP-43 from stress-induced aggregation.
a, Statistical analysis of TDP-43–FKBP insolubility in response to heat stress or treatment with sodium arsenite. The insoluble fraction (in % of total Flag-TDP-43) of Flag-TDP-43–FKBP (WT, 1×SUMO2 or 4×SUMO2) in solubility assays as shown in Fig. 1b,c. P values of two-tailed, unpaired Student’s t-tests are indicated; error bars show the standard deviation of the mean (n = 3). b, Enrichment of ubiquitylated TDP-43 by Ni-NTA pull down. HEK293T cells were transfected with His-Ub together with Flag-TDP-43, Flag-4×SUMO2–TDP-43 or an empty vector for 48 h and were treated with heat stress (43 °C, 1 h) or left untreated prior to lysis. Ubiquitylated proteins were enriched by denaturing Ni-NTA pull down. c, Statistical analysis of Flag-TDP-43 (WT, 1×SUMO2 or 4×SUMO2) insolubility in response to heat stress or treatment with sodium arsenite and MG132 (10 µm, 4 h) as shown in Fig. 1d. P values of two-tailed unpaired Student’s t-tests are indicated; error bars show the standard deviation of the mean (n = 3). d, Statistical analysis of Flag-TDP-43 (WT, 1×SUMO2 or 4×SUMO2) insolubility in response to heat stress or treatment with sodium arsenite and DBeQ (20 µm, 4 h) as shown in Fig. 1e. P values of two-tailed unpaired Student’s t-tests are indicated; error bars show the standard deviation of the mean (n = 3). Source data
Extended Data Fig. 2
Extended Data Fig. 2. SUMO2-modified TDP-43 is associated with PML NBs.
a, GO biological process (GOBP) enrichment analysis of proteins interacting with Flag-TDP-43. Proteins that were exclusively identified in all three replicates of IPs from Flag-TDP-43 expressing cells and proteins that were significantly enriched in IPs from Flag-TDP-43 expressing cells (vs. Flag-TDP-43) were combined into a dataset and used for GOBP enrichment analysis. Selected GOBP terms with at least threefold enrichment are shown. b, Volcano plot displaying the results of interactomes performed in HEK293T cells expressing Flag-SUMO2–TDP-43 or Flag-TDP-43. The difference of the log2 mean LFQ intensities between Flag-1×SUMO2–TDP-43 and Flag-TDP-43 expressing cells was plotted against the negative logarithmised p values of a Student’s t-test. Proteins significantly enriched in IPs from cells expressing Flag-SUMO2–TDP-43 (log2(SUMO2–TDP-43/TDP-43) > 1 and p value < 0.05) are highlighted in red. TDP-43 and proteins associated with PML NBs are indicated. c, Immunofluorescence images of HeLa cells transfected with either Flag-TDP-43, Flag SUMO2-TDP-43 or Flag-4xSUMO2-TDP-43. Endogenous PML is shown in magenta. d, Statistical analysis of Flag-TDP-43 (WT, 1xSUMO2 or 4xSUMO2) enrichment in PML NBs in HeLa cells as shown in c. Left: The Flag-TDP-43/PML signal ratio in the combined area of all PML NBs in a cell was determined and normalised to Flag-TDP-43 expression levels in the nucleus of the same cell. Right: The correlation of Flag-TDP-43 and PML signals within the nucleus was determined. P-values of two-tailed, unpaired student’s t-tests are shown. At least 51 cells were measured per condition. e, The efficiency of Topors knockdowns was determined by qPCR. HEK293T cells were transfected for 72 hours with a control siRNA or one of the two siRNAs against Topors. P-values of one sample t-tests are indicated (n = 3). Source data
Extended Data Fig. 3
Extended Data Fig. 3. Recruitment of HA-TDP-43-FKBP to PML NBs.
a, Statistical analysis of the immunofluorescence images shown in Fig. 3c. Enrichment of HA–TDP-43–FKBP in Myc-positive PML nuclear bodies (leftmost plot) and the correlation of the indicated signal pairs within the nucleus were analyzed. P values of two-tailed, unpaired Student’s t-tests are shown. At least 55 cells were measured per condition. b, HeLa cells were transfected with WT FRB–PML–Myc (WT V57,60S or L73E) and HA–TDP-43–FKBP for 24 h and either treated DMSO or rapamycin (100 nM, 4 h). Insets are marked with yellow squares. Scale bar, 2 µm. c, HeLa cells were transfected with WT FRB–PML–Myc and HA–TDP-43–FKBP for 24 h and either treated with DMSO or rapamycin (100 nM, 4 h). FRB–PML–Myc and PIAS1 were detected with anti-Myc and anti-PIAS1 antibodies and are shown in red and green, respectively. Inset areas are indicated with yellow squares. Scale bar, 10 µm. Source data
Extended Data Fig. 4
Extended Data Fig. 4. Recruitment of endogenously FKBP-tagged TDP-43 to PML NBs.
a, Enrichment of SUMOylated HA–TDP-43–FKBP by Ni-NTA pull down. HEK293T cells were depleted of PIAS1 by siRNA transfection or transfected with a control siRNA. Cells were then transfected with FRB–PML–Myc, HA–TDP-43–FKBP and His-SUMO2. Signal intensities of high-molecular-weight bands (running above the height of unmodified HA–TDP-43VFKBP) in pull-down samples (anti-HA) were quantified and normalized to the respective intensities in the matching input lane. Relative values are listed below the top right panel. b, Top: HeLa cells were edited to express TDP-43–FKBP–HA from the endogenous gene locus. A double-strand break was introduced at the end of the last exon of TDP-43 using the CRISPR/LbCas12a system. A repair template harboring an FKBP12–HA and a puromycin resistance cassette (not shown in model) was then integrated by homologous recombination. Arrows indicate PCR primers used for the validation of successful editing events. Bottom left: genomic DNA was isolated and amplified with the indicated primers. PCR products were analyzed by agarose gel electrophoresis. The clone shown in lane a was transduced with lentiviral particles to stably express FRB–PML–Myc. The clone in lane b was excluded due to an additional (ca. 800 bp) PCR product. Parental HeLa cells were analyzed in lane c. Bottom right: expression of TDP-43–FKBP–HA and FRB–PML–Myc was assayed by western blotting. Parental HeLa cells in lane 1 served as a control. TDP-43–FKBP–HA was detected with both anti-HA and anti-TDP-43 antibodies at ca. 63 kDa. (Detection of WT TDP-43 at ca. 43 kDa with the anti-TDP-43 antibody indicated the presence of ca. 50% unedited TDP-43 alleles.). Panel b is created with BioRender.com. c, Expression of TDP-43–FKBP–HA and FRB–PML–Myc and rapamycin-induced recruitment of TDP-43 in the edited cells described in b were analyzed by immunofluorescence microscopy. Cells were either treated with DMSO or rapamycin (100 nM, 4 h). Scale bar, 10 µM. Source data
Extended Data Fig. 5
Extended Data Fig. 5. Recruitment to PML enhances SUMOylation and ubiquitylation of disease associated TDP-43 mutants.
a, Enrichment of ubiquitylated HA–TDP-43–FKBP by Ni-NTA pull down. HEK293T cells were transfected with His-Ub together with FRB–PML–Myc and HA–TDP-43–FKBP. Cells were treated with heat stress (43 °C, 1 h) or left untreated. Where indicated, cells were treated with rapamycin (100 nM, 4 h) and TAK-981 (500 nM, 4 h). Signal intensities of high-molecular-weight bands (running above the height of unmodified HA–TDP-43–FKBP) in pull-down samples (anti-HA) were quantified and normalized to the respective intensities in the matching input lane. Relative values are listed below the top right panel. b, Enrichment of SUMOylated HA–TDP-43–FKBP by Ni-NTA pull down. HEK293T cells were transfected with His-SUMO2 together with FRB–PML–Myc and HA–TDP-43–FKBP. Where indicated, cells were treated with rapamycin (100 nM, 4 h) and TAK-243 (10 µm, 4 h). Relative intensities of high-molecular-weight TDP-43–FKBP were determined as described in a. c, Enrichment of SUMOylated HA–TDP-43–FKBP by Ni-NTA pull down. HEK293T cells were transfected with His-SUMO2 together with FRB–PML–Myc and HA–TDP-43–FKBP (WT, P112H or K263E). Where indicated, cells were treated with rapamycin (100 nM, 4 h). d, Enrichment of ubiquitylated HA–TDP-43–FKBP by Ni-NTA pull down. HEK293T cells were transfected with His-Ub together with FRB–PML–Myc and HA–TDP-43–FKBP (WT, P112H or K263E). Where indicated, cells were treated with rapamycin (100 nM, 4 h). Source data
Extended Data Fig. 6
Extended Data Fig. 6. Statistical analysis of the protective role of TDP-43 recruitment into PML NBs against stress-induced TDP-43 insolubility.
a, Statistical analysis of HA–TDP-43–FKBP insolubility. The insoluble fraction of HA–TDP-43–FKBP (in % of total HA–TDP-43–FKBP) was determined in solubility assays, as shown in Fig. 5a. P values of two-tailed, unpaired Student’s t-tests are indicated; error bars show the standard deviation of the mean (n = 3). b, Statistical analysis of HA–TDP-43–FKBP insolubility. First and third graphs: the insoluble fraction of HA–TDP-43–FKBP (in % of total HA–TDP-43–FKBP) was determined in solubility assays as shown in Fig. 5b. Second and fourth graphs: the relative decrease in insoluble HA–TDP-43–FKBP upon treatment with rapamycin (=rescue) in samples treated with DMSO or MG132 is shown. The mean rescue in DMSO-treated cells was set to 100%. P values of two-tailed, paired Student’s t-tests are indicated; error bars show the standard deviation of the mean (n = 3). c, Statistical analysis of HA–TDP-43–FKBP insolubility as in b, but samples were treated with DBeQ instead of MG132. Solubility assays were performed as shown in Fig. 5c. P values of two-tailed, paired Student’s t-tests are indicated; error bars show the standard deviation of the mean (HS, n = 5; SA, n = 4). d, Statistical analysis of HA–TDP-43–FKBP (WT, P112H and K263E) insolubility. The insoluble fraction of HA–TDP-43–FKBP variants (in % of total HA–TDP-43–FKBP) was determined in solubility assays, as shown in Fig. 5e. P values of two-tailed, unpaired Student’s t-tests are indicated; error bars show the standard deviation of the mean (n = 3). e, Statistical analysis of TDP-43–FKBP–HA insolubility. Assays as shown in Fig. 5f were performed with HeLa cells engineered to express TDP-43–FKBP–HA from the endogenous TDP-43 locus and transduced with lentiviral particles to stably express FRB–PML–Myc. The insoluble fraction of HA–TDP-43–FKBP variants (in % of total TDP-43–FKBP–HA) was determined. P values of two-tailed, unpaired (left) and one-sample (right) Student’s t-tests are indicated; error bars show the standard deviation of the mean (n = 3). Source data
Extended Data Fig. 7
Extended Data Fig. 7. Stress enhances TDP-43 association with PML NBs and stress granules, with increased TDP-43 in stress granules upon PML depletion.
a, Statistical analysis of HA–TDP-43–FKBP insolubility assays as shown in Fig. 5g with HeLa cells engineered to express TDP-43–FKBP–HA from the endogenous TDP-43 locus and FRB–PML–Myc from a lentiviral expression cassette. Treatments: heat stress (43 °C, 1 h), sodium arsenite (0.5 mM, 1 h) or no stress treatment combined with rapamycin (100 nM, 4 h) or DMSO. P values of two-tailed, unpaired Student’s t-tests are indicated (n = 3). b, Statistical analysis of the enrichment of mClover3–TDP-43 in PML NBs in HeLa cells as shown in Fig. 5h. Cells were treated with sodium arsenite (0.5 mM, 30 or 1 h) or left untreated. Left: the mean intensity of the TDP-43–mClover3 within the area PML NBs was divided by the mean intensity within the nucleus of the same cell. Right: correlation between mClover3–TDP-43 and mRuby3–PML within the nucleus of transfected cells. At least 65 cells per condition were analyzed. P values of two-tailed, unpaired Student’s t-tests are indicated. c, Left: immunofluorescence images of endogenous PML and TDP-43. HeLa cells were left untreated or treated with sodium arsenite (0.5 mM, 1 h). Inset areas are indicated. Right: statistical analysis of the TDP-43 signal enrichment within PML NBs upon sodium arsenite treatment. P values of two-tailed, unpaired Student’s t-tests are indicated. At least 120 cells per condition were analyzed. d, Immunofluorescence images of G3BP2 in HeLa cells stably expressing TDP-43–GFP. Cells were transfected with control siRNA or with an siRNA directed against PML for 48 hours. Treatment: sodium arsenite (0.5 mM, 1 h). Left: yellow circles indicate large stress granules. Right: the relative intensity of TDP-43–GFP within the area of SGs was determined and normalized to the mean value in cells transfected with control siRNA. At least 96 cells/condition were analyzed. Error bars indicate the standard error of the mean. The p value of a two-tailed, unpaired Student’s t-test is indicated. Source data
Extended Data Fig. 8
Extended Data Fig. 8. Recruitment to the PML NB core component Sp100 protects TDP-43 from stress-induced aggregation.
a, HeLa cells were genetically engineered to express RNF4-3×Flag from the endogenous RNF4 locus. Cells were transfected with FRB–Sp100–Myc and HA–TDP-43–FKBP for 24 h and either mock-treated or treated with rapamycin (100 nM, 3 h). Inset areas are indicated with yellow squares. Scale bar, 5 µm. b, Statistical analysis of the images shown in a. Enrichment of HA–TDP-43–FKBP in FRB–Sp100–Myc-positive nuclear bodies (leftmost plot) and the correlation of the indicated signal pairs within the nucleus were analyzed. At least 55 cells per condition were measured. The p values of two-tailed, unpaired Student’s t-tests are indicated. c, Statistical analysis of HA–TDP-43–FKBP insolubility in HEK293T cells transfected with HA–TDP-43–FKBP and FRB–Sp100–Myc. The insoluble fraction of HA–TDP-43–FKBP (in % of total HA–TDP-43–FKBP) was determined in solubility assays, as shown in Fig. 5i. P values of two-tailed, unpaired Student’s t-tests are indicated; error bars show the standard deviation of the mean (n = 3). Source data

References

    1. Hipp, M. S., Kasturi, P. & Hartl, F. U. The proteostasis network and its decline in ageing. Nat. Rev. Mol. Cell Biol.20, 421–435 (2019). - PubMed
    1. Ou, S. H., Wu, F., Harrich, D., Garcia-Martinez, L. F. & Gaynor, R. B. Cloning and characterization of a novel cellular protein, TDP-43, that binds to human immunodeficiency virus type 1 TAR DNA sequence motifs. J. Virol.69, 3584–3596 (1995). - PMC - PubMed
    1. Tziortzouda, P., Van Den Bosch, L. & Hirth, F. Triad of TDP43 control in neurodegeneration: autoregulation, localization and aggregation. Nat. Rev. Neurosci.22, 197–208 (2021). - PubMed
    1. Bentmann, E., Haass, C. & Dormann, D. Stress granules in neurodegeneration—lessons learnt from TAR DNA binding protein of 43 kDa and fused in sarcoma. FEBS J.280, 4348–4370 (2013). - PubMed
    1. Wolozin, B. & Ivanov, P. Stress granules and neurodegeneration. Nat. Rev. Neurosci.20, 649–666 (2019). - PMC - PubMed

LinkOut - more resources