. 2025 Apr 17;15(1):13347.
doi: 10.1038/s41598-025-98209-3.

Combining RNA-seq, molecular docking and experimental verification to explore the mechanism of BAM15 as a potential drug for atherosclerosis

Affiliations

Combining RNA-seq, molecular docking and experimental verification to explore the mechanism of BAM15 as a potential drug for atherosclerosis

Minghui Ma et al. Sci Rep. .

Abstract

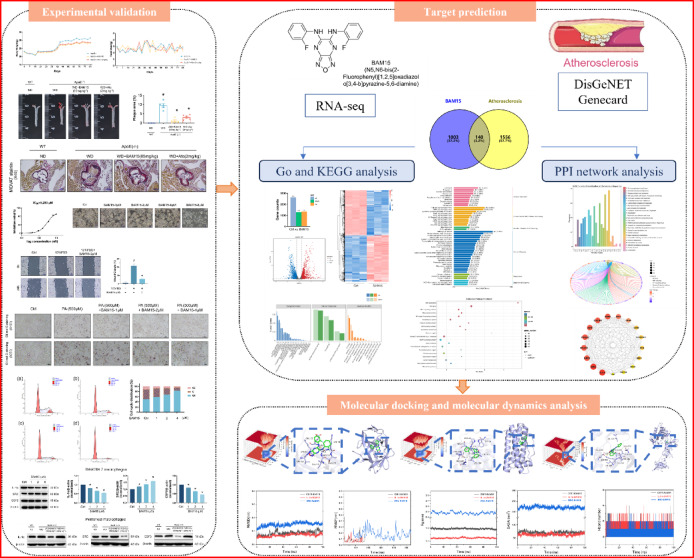
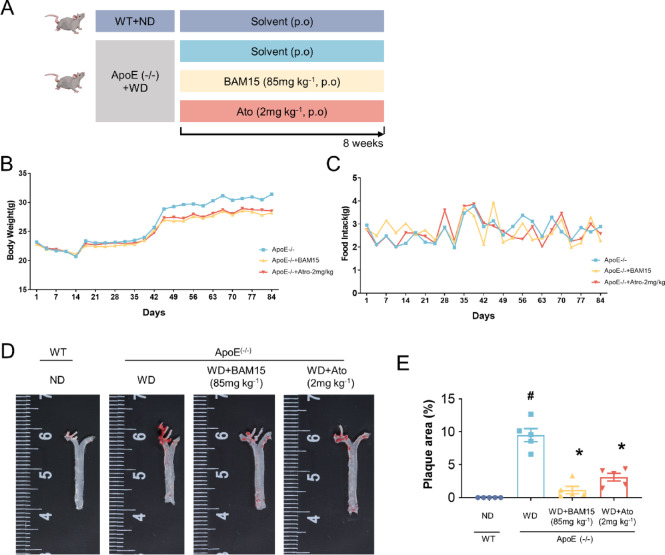
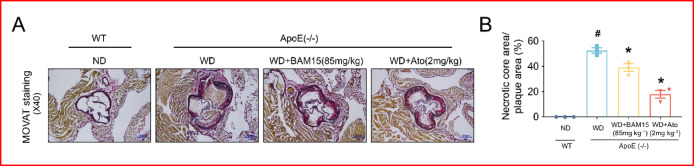
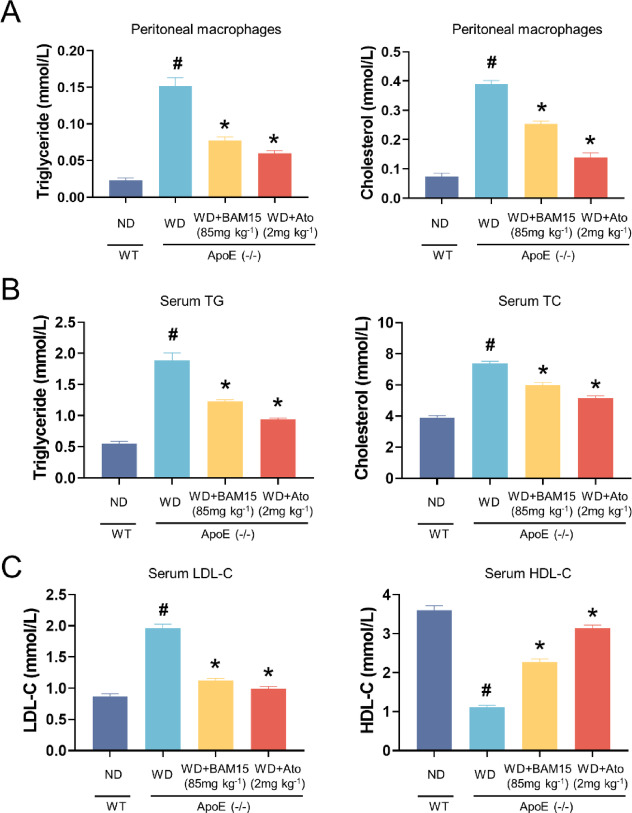
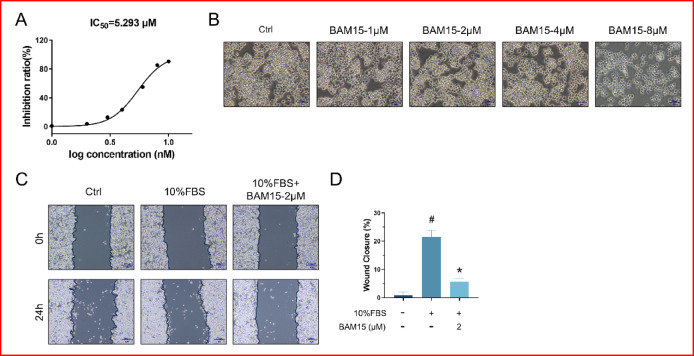
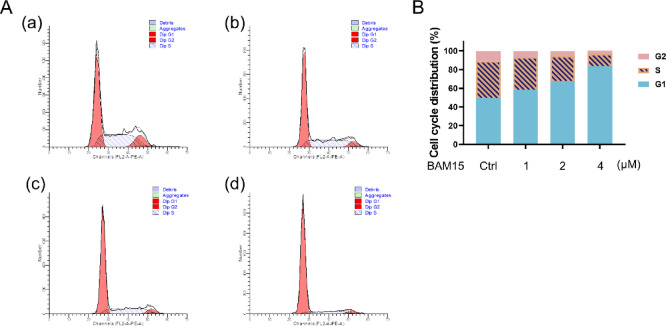
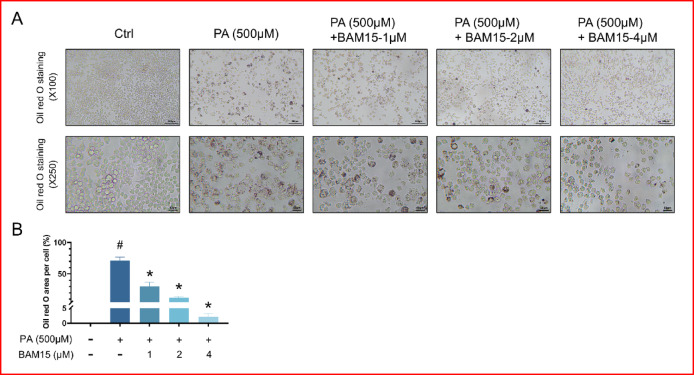
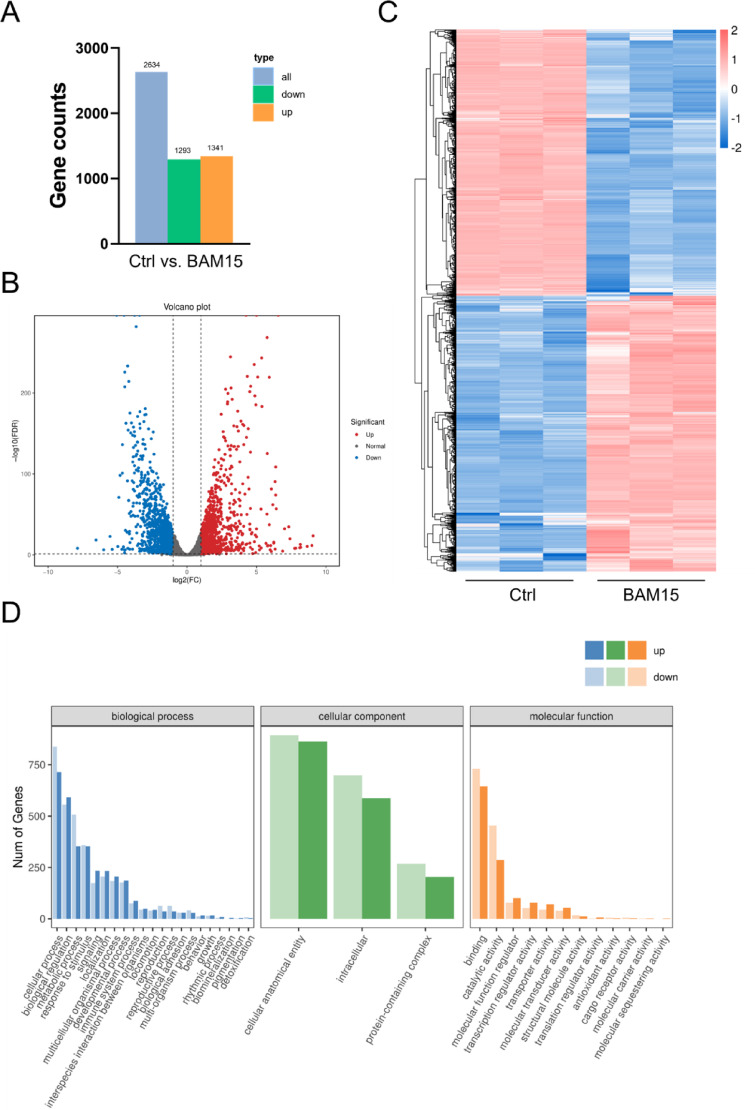
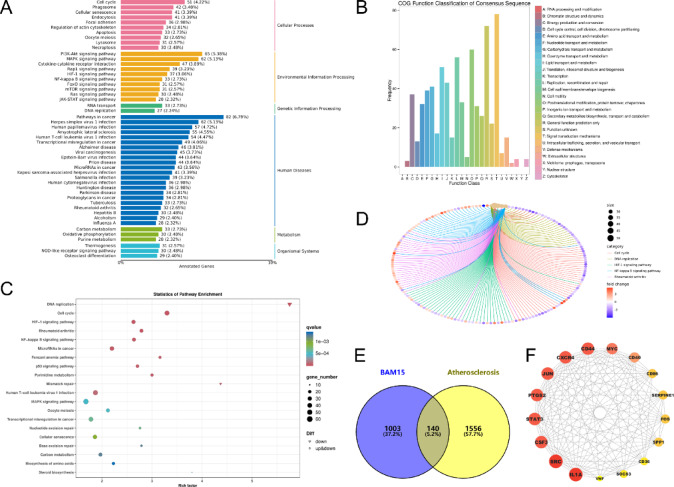
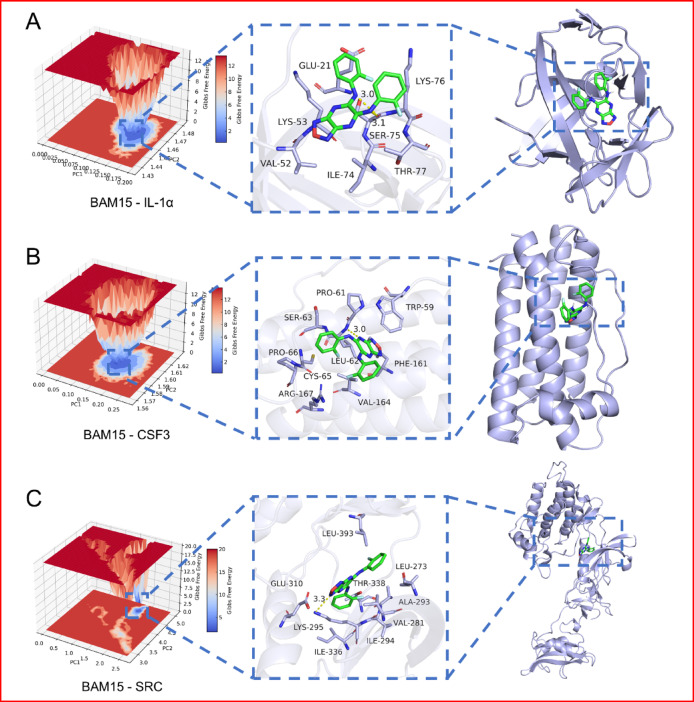
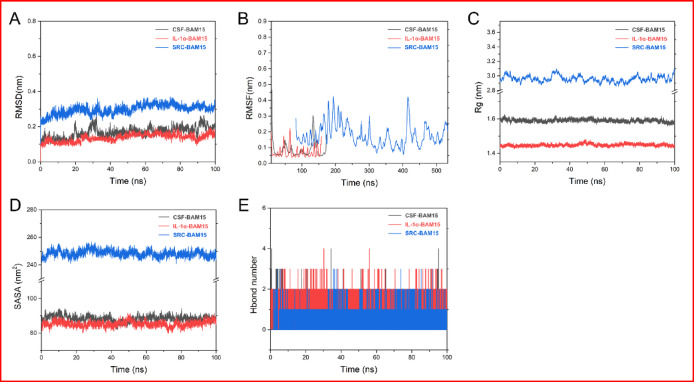
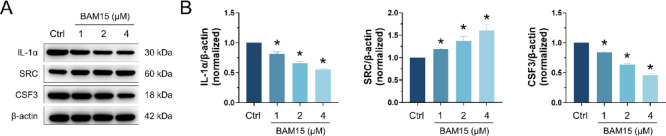
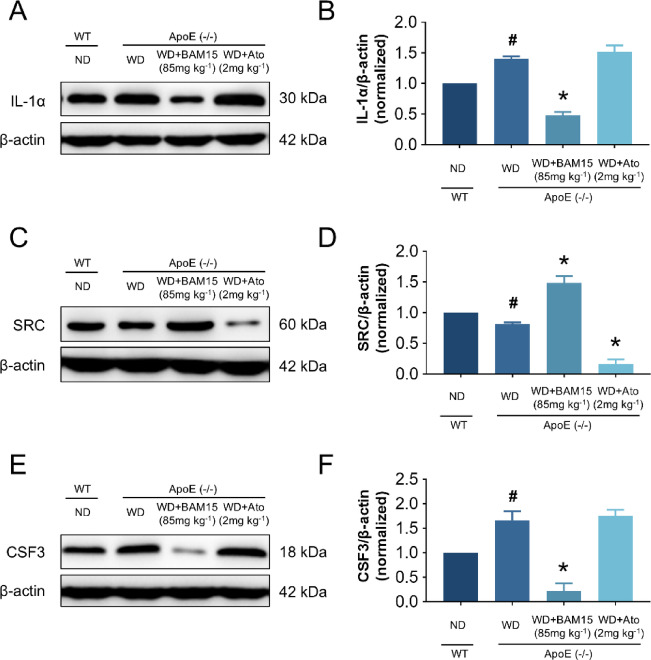
BAM15 is a novel mitochondrial uncoupling agent derived from a synthetic source, that has been wildly explored for its ability to enhance mitochondrial respiration and metabolic flexibility. In this study, we investigated the underlying mechanisms of BAM15 on atherosclerosis (AS) through experimental validation, RNA-seq and molecular docking. The results showed that oral administration of BAM15 suppressed atherosclerosis in western diet (WD)-fed ApoE(-/-) mice and significantly improved the hyperlipidemia. And the increased serum ALT, AST and liver TC, TG, ALT, AST in ApoE(-/-) mice were reduced by BAM15 treatment. In in vitro experiments BAM15 inhibited RAW264.7 macrophages invasive ability and reduced palmitic acid-induced lipid accumulation. RNA-seq results confirmed the differential genes after BAM15 treatment and 140 common targets were identified by intersecting with AS-related targets. A protein-protein interaction (PPI) network analysis high-lighted IL1A, SRC and CSF3 as key targets of BAM15 against AS, which is further verified by molecular docking and western blot. Molecular dynamics analysis results confirmed that BAM15 exhibits strong affinity with the IL-1α, SRC and CSF3 proteins. This study indicates that BAM15 inhibits atherosclerosis through a multi-molecular mechanism, and we propose it as a novel anti-atherosclerotic drug.

Keywords: Atherosclerosis; BAM15; Molecular docking; Molecular mechanism; RNA-seq.


Conflict of interest statement

Declarations. Ethics approval and consent to participate: We confirmed that all experiments were performed in accordance with relevant named guidelines and regulations. And the authors complied with the ARRIVE guidelines for animal experiments. The animal study protocol was approved by the Institutional Review Board of Jiangnan University Medical Center (protocol code 2021-Y-51, 31-Aug-2021). Competing interests: The authors declare no competing interests.

Figures

Fig. 1
Fig. 1
Flow chart.
Fig. 2
Fig. 2
BAM15 inhibited the formation of atherosclerotic plaque in ApoE(−/−) mice fed with Western Diet. A Schematic diagram of the design of in vivo experiments. B, C The time course of body weight and average food intake changes. The food intake every three days was averaged. D, E Representative images of aorta oil red O staining and summarized data of plaque area ratio. n = 5 in WT, ApoE(−/−), ApoE(−/−) + BAM15 (85 mg kg−1) and ApoE(−/−) + Ato (2 mg kg−1), *P < 0.05 vs. ApoE(−/−). #P < 0.05 vs. WT. Ato, atorvastatin, ND normal diet, WD western diet, WT wild type.
Fig. 3
Fig. 3
BAM15 inhibited the atherosclerosis in the aortic root of ApoE(−/−) mice fed on a Western diet for 8 weeks. A The representative MOVAT staining of aortic root at the level of the tricuspid valves, and the framed area was enlarged. B Statistical data of MOVAT staining, n = 3. *P < 0.05 vs. ApoE(−/−). #P < 0.05 vs.WT. Ato atorvastatin, ND normal diet, WD western diet, WT wild type.
Fig. 4
Fig. 4
The effect of BAM15 on hyperlipidemia induced by WD feeding in ApoE(−/−) mice. A The total cholesterol and triglyceride content of peritoneal macrophages. n = 10 in WT, n = 15 in ApoE(−/−), ApoE(−/−) + BAM15 (85 mg kg−1) and ApoE(−/−) + Ato (2 mg kg−1). *P < 0.05 vs. ApoE(−/−). #P < 0.05 vs.WT. B, C BAM15 reduced the elevated blood lipids induced by WD feeding in ApoE(−/−) mice. n = 10 in WT, n = 15 in ApoE(−/−), ApoE(−/−) + BAM15 (85 mg kg−1) and ApoE(−/−) + Ato (2 mg kg−1). *P < 0.05 vs. ApoE(−/−). #P < 0.05 vs.WT. Ato, atorvastatin, TC total cholesterol, TG triglyceride, HDL-C high density lipoprotein cholesterol, LDL-C high density lipoprotein cholesterol.
Fig. 5
Fig. 5
The effect of BAM15 on the cell activity, proliferation and migration of RAW264.7 macrophages. A The proliferation of RAW264.7 macrophages was assessed by CCK-8 assay after 24 h of treatment with the different concentrations of BAM15. B Representative images of RAW264.7 macrophages cell state treated with BAM15 (1–8 µM) for 24 h. n = 3. C Representative images showed migration of RAW264.7 macrophages treated with BAM15 (2 µM) at the time 0 and 24 h measured by scratch wound-healing assay. D Statistical data of wound closure, n = 5. *P < 0.05 vs. FBS (10%), #P < 0.05 vs. Ctrl.
Fig. 6
Fig. 6
The effect of BAM15 on the cell cycle of RAW264.7 macrophages. A, B The representative original recordings of cell cycle (a) Ctrl, (b) BAM15 (1 µM), (c) BAM15 (2 µM), (d) BAM15 (4 µM) and the analyzed data.
Fig. 7
Fig. 7
BAM15 inhibited PA-induced increase of lipid in RAW264.7 macrophages. A Representative images of oil red O staining. B Statistical data of oil red O staining, n = 4 in oil red O staining (× 250 magnification) and n = 3 in oil red O staining (× 100 magnification). *P < 0.05 vs. PA (500 µM), #P < 0.05 vs. Ctrl.
Fig. 8
Fig. 8
Identification of DEGs and GO functional enrichment analysis. A The number of genes in each differentially expressed gene set. The horizontal coordinate represented different sets of differential genes, and vertical coordinates represented the number of differential genes. Blue represented all differential genes, orange represented up-regulated genes, green represented down-regulated genes. B In volcano plot, each dot represented a gene. X-axis: log2 Fold change of expression; Y-axis: – log10(FDR) or – log10(P-value). Green dots are down-regulated genes, while red dots were up-regulated ones and black dots were genes without significant difference. C Hierarchical cluster analysis of differentially expressed genes between Ctrl and BAM15 group, increasing in expression were indicated in red hues and decrease were in blue hues. Ctrl, control group. D GO functional enrichment analysis of targets in the treatment of BAM15. X-axis was Go terms and classifications; Y-axis represented the number of DEGs annotated to the term (right) and percentage of that in all DEGs (Left).
Fig. 9
Fig. 9
KEGG analysis and PPI network construction. A Taxonomic analysis of KEGG enrichment pathways. Y-axis represented KEGG pathway terms; X-axis represented the percentage of genes annotated to the KEGG pathway. B COG Classification on DEGs. X-axis: COG classification terms; Y-axis: Number of genes in the term. C The number of genes enriched in each KEGG pathway term was represented by a bar and the P-value was shown by different colors. D Network diagram of KEGG pathway. The color of the edge represented different pathways, and the color of the gene node represented the difference fold. E The potential target genes in BAM15 and AS in the intersection. BAM15 was shown as purple circle. AS was represented as yellow circle. F Protein interaction network by Cytoscape 3.9.1 software. The node size and color represent the size of the degree. Node size was proportional to its degree; node color was from yellow to red, and the corresponding degree gradually larger.
Fig. 10
Fig. 10
The binding mode of key proteins with BAM15 after 100ns molecular dynamics. AC Free energy landscape and the binding mode of BAM15 with (A) IL-1α (PDB ID:5UC6), (B) CSF3 (PDB ID: 5GW9) and (C) SRC (PDB ID:1Y57) after 100 ns molecular dynamics.
Fig. 11
Fig. 11
Molecular dynamics analysis. AE Comparative post-dynamic data showing (A) RMSD, (B) RMSF, (C) Rg, (D) SASA and (E) number of intramolecular H-bond plots of BAM15-CSF3, -IL-1α and -SRC systems over a 100 ns simulation period.
Fig. 12
Fig. 12
The effect of BAM15 on the expression of proteins encoded by IL1 A, SRC and CSF3 in RAW264.7 macrophages. A, B The representative western blots and analyzed data of IL-1α, SRC and CSF3 protein levels. n = 3 in each group. *P < 0.05 vs. Ctrl. Ctrl, control.
Fig. 13
Fig. 13
The effect of BAM15 on IL-1α, SRC and CSF3 expression in peritoneal macrophages of ApoE(−/−) mice. AF The representative western blots and analyzed data of IL-1α, SRC and CSF3 protein levels in peritoneal macrophages of ApoE(−/−) mice. n = 3 in each group. *P < 0.05 vs. ApoE(−/−). #P < 0.05 vs.WT. Ato atorvastatin, ND normal diet, WD western diet, WT wild type.

Similar articles

Cited by

References

    1. Björkegren, J., Lusis, A. J. C. & Atherosclerosis Recent developments. Cell185 (10), 1630–1645 (2022). - PMC - PubMed
    1. Xu, S., Pelisek, J. & Jin, Z. J. Atherosclerosis is an epigenetic disease. Trends Endocrinol. Metab.29(11), 739–742 (2018). - PMC - PubMed
    1. Libby, P. J. The changing landscape of atherosclerosis. Nature592(7855), 524–533 (2021). - PubMed
    1. Lechner, K. et al. Lifestyle factors and high-risk atherosclerosis: pathways and mechanisms beyond traditional risk factors. Eur. J. Prev. Cardiol.27 (4), 394–406 (2020). - PMC - PubMed
    1. Libby, P. et al. Atherosclerosis. Nat. Rev. Dis. Primers. 5 (1), 56 (2019). - PubMed

Substances