. 2025 Apr 17;15(1):13298.
doi: 10.1038/s41598-025-96794-x.

An automatic sustained attention prediction (ASAP) method for infants and toddlers using wearable device signals

Affiliations

An automatic sustained attention prediction (ASAP) method for infants and toddlers using wearable device signals

Yisi Zhang et al. Sci Rep. .

Abstract

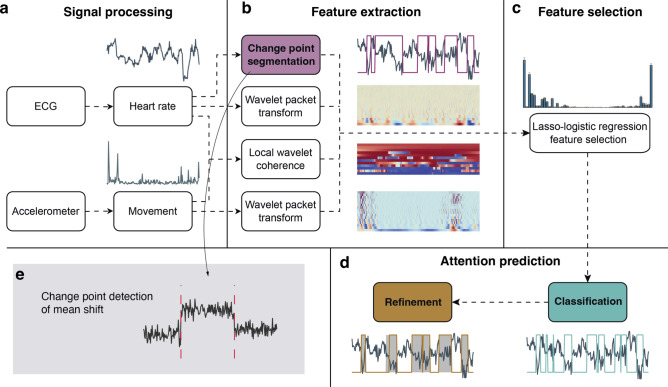
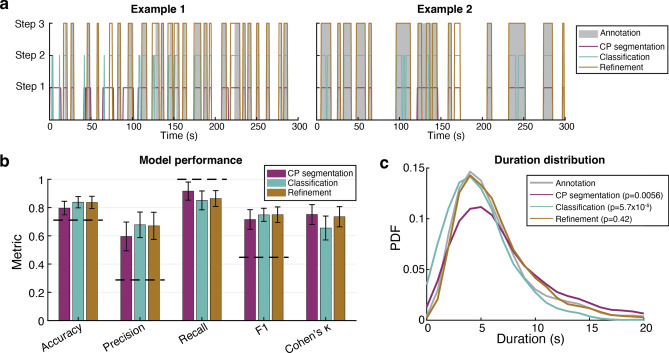
Sustained attention (SA) is a critical cognitive ability that emerges in infancy and affects various aspects of development. Research on SA typically occurs in lab settings, which may not reflect infants' real-world experiences. Infant wearable technology can collect multimodal data in natural environments, including physiological signals for measuring SA. Here we introduce an automatic sustained attention prediction (ASAP) method that harnesses electrocardiogram (ECG) and accelerometer (Acc) signals. Data from 75 infants (6- to 36-months) were recorded during different activities, with some activities emulating those occurring in the natural environment (i.e., free play). Human coders annotated the ECG data for SA periods validated by fixation data. ASAP was trained on temporal and spectral features from the ECG and Acc signals to detect SA, performing consistently across age groups. To demonstrate ASAP's applicability, we investigated the relationship between SA and perceptual features-saliency and clutter-measured from egocentric free-play videos. Results showed that saliency in infants' and toddlers' views increased during attention periods and decreased with age for attention but not inattention. We observed no differences between ASAP attention detection and human-coded SA periods, demonstrating that ASAP effectively detects SA in infants during free play. Coupled with wearable sensors, ASAP provides unprecedented opportunities for studying infant development in real-world settings.

Keywords: Computational model; Electrocardiogram; Infant development; Naturalistic studies; Sustained attention; Visual saliency; Wearable sensors.


Conflict of interest statement

Declarations. Competing interests: The authors declare no competing interests.

Figures

Fig. 1
Fig. 1
A pipeline schematic for data collection to train the SA prediction model. Two synchronised wearable devices record the data: the ECG/Acc body sensors (top cloud) and the head-mounted eye tracker (bottom cloud). During data processing, HR is extracted and then undergoes change points detection (CPD) to facilitate human coding of attention, validated by object fixation (objects coded by colours). During attention prediction, HR- and Acc-derived time series and change point segmentation form the feature matrix for training a machine learning model to predict attention periods. During model application, visual clutter and saliency signals are extracted from video frames to evaluate the model’s effectiveness.
Fig. 2
Fig. 2
The wearable body sensor. (a) Example of a 9-months-old infant wearing the head-mounted eye tracker with the body sensors. (b) The Biosignals Plux wearable sensors: 1—the data recording hub; 2—the light sensor; 3—the acceleration sensor; 4—the ECG sensor with the Ambu blue electrodes (Ambu, Copenhagen, Denmark) attached; 5—the custom-made shirt. (c) The back view of the shirt showing how the sensors were embedded: 1—eyelet, which allows the ECG and Acc sensors to be brought from the back to the front and positioned on the left side of the chest; 2—the back pocket, which holds the data recording hub; 3—the shirt closes at the back via hook and loop. (d) Front view of the shirt with the sensors embedded, illustrating the location of the ECG sensor.
Fig. 3
Fig. 3
Example of human-coded sustained attention for a 6-month-old participant for a 1-min time window. (a) The solid blue line indicates the HR time series (in bpm). The vertical dashed black lines indicate change points which divide the HR time series into segments. The horizontal dashed black lines show the mean HR for each segment. The change in mean HR relative to the preceding segment is displayed in the top left of each segment (red indicates deceleration; black indicates acceleration). The grey regions indicate sustained attention periods. In the third grey region, the onset time was shifted to the first HR peak before the change point as the change in HR was − 4.3 bpm, with the change between the HR peak immediately before and after the change point > 5 bpm. (b) The fixated objects from the eye-tracking data. Each unique colour bar represents a unique object (57 total objects), e.g., purple bars represent periods of fixation on a plush giraffe. (c) Three representative frames from the infant’s egocentric view were extracted at each point in time corresponding to the numbered grey circles from Panel B. The fixation (blue crosshair) and participant-eye view from the eye tracker are superimposed onto each frame. The plush giraffe outlined and shaded in purple corresponds to the purple bars in Panel B (periods when the infant fixates on the giraffe).
Fig. 4
Fig. 4
Example of a saliency time series during free play. (a) The fixation time series is divided into consecutive 5-s time windows (150 frames at 30 Hz). A spatial window was created around each fixation (radius, r = 50 pixels; white circles). (b) All fixations within each 5-s time window are accumulated to form a binary fixation mask (black pixels = 0, white pixels = 1). (c) The saliency maps within each window are extracted (15 frames at 3 Hz). (d) Each saliency map within a 5-s time window is multiplied by the corresponding binary fixation mask for that window. (e) The saliency time series is created by averaging across all pixels within the respective binary fixation mask at each time point. The same procedure is used for the clutter time series. For a detailed illustration of the binary fixation mask applied to a saliency map, see Figure S3.
Fig. 5
Fig. 5
ASAP procedure overview. (a) Signal processing to extract heart rate (HR) and movement (acceleration magnitude). (b) Feature extraction to produce change point segments, wavelet packet transforms of HR and Acc, and local wavelet coherence between HR and Acc. (c) Feature selection using Lasso regularised logistic regression. (d) Attention prediction using logistic regression with selected features and further refinement to reconstruct the temporal structure. Coloured boxes in (b)–(d) indicate the three stages of attention prediction. (e) An example of change point detection of mean shift.
Fig. 6
Fig. 6
Feature importance by Lasso regularised logistic regression. Importance is measured using the absolute values of the standardised logistic regression coefficients, averaged across the fivefold cross-validation. Error bars are standard deviations across the fivefold cross-validation. Selected features had mean Importance > 0.03 (threshold determined by cross-validation). WPT-HR: wavelet packet transform of HR; WPT-Acc: wavelet packet transform of Acc; LSW-HR-Acc: local stationary wavelet estimated coherence between HR and Acc. In these cases, each bar corresponds to a frequency band.
Fig. 7
Fig. 7
ASAP performance. (a) Two examples of attention prediction through 3 steps. (b) A summary of performance metrics. Colour codes are identical to (a) and Fig. 5. Dashed lines indicate null estimates. The null is obtained for accuracy when guessing all negative; for precision, recall, and F1, the null is calculated with all-positive guesses. Error bars are standard deviations. (c) Distributions of segment duration are obtained from each step. P-values revealing the distribution similarity are based on KS test. CP: change point. PDF: probability density function.
Fig. 8
Fig. 8
Effects of attention on visual features. (a) Violin plot of the attentional effect on visual saliency. (b) Interaction effect on visual saliency between attentional states and age, with lines fitted by linear regression. (c) and (d) respectively show the equivalent graphs for clutter.

Similar articles

Cited by

References

    1. Reynolds, G. D. & Romano, A. C. The development of attention systems and working memory in infancy. Front. Syst. Neurosci.10.3389/fnsys.2016.00015 (2016). - PMC - PubMed
    1. Rose, S. A., Feldman, J. F. & Jankowski, J. J. Attention and recognition memory in the 1st year of life: A longitudinal study of preterm and full-term infants. Dev. Psychol.37, 135–151. 10.1037/0012-1649.37.1.135 (2001). - PubMed
    1. Ruff, H. A. & Lawson, K. R. Development of sustained, focused attention in young children during free play. Dev. Psychol.26, 85–93. 10.1037/0012-1649.26.1.85 (1990).
    1. Casey, B. J. & Richards, J. E. Sustained visual attention in young infants measured with an adapted version of the visual preference paradigm. Child Dev.10.2307/1130666 (1988). - PubMed
    1. Brandes-Aitken, A., Metser, M., Braren, S. H., Vogel, S. C. & Brito, N. H. Neurophysiology of sustained attention in early infancy: Investigating longitudinal relations with recognition memory outcomes. Infant Behav. Dev.10.1016/j.infbeh.2022.101807 (2023). - PMC - PubMed

LinkOut - more resources