. 2025 Apr 18;30(1):48.
doi: 10.1186/s11658-025-00725-7.

Circulating innate lymphoid cells are dysregulated in patients with prostate cancer

Affiliations

Circulating innate lymphoid cells are dysregulated in patients with prostate cancer

Daniela Claudia Maresca et al. Cell Mol Biol Lett. .

Abstract

Background: Prostate cancer (PCa) is the second most common cancer affecting men globally, especially those aged 50 years and above. Despite substantial progress in terms of both prognosis and therapy, PCa remains a significant health concern, necessitating the identification of novel therapeutic targets. Innate lymphoid cells (ILCs) have emerged as critical modulators of tumor immunity, exhibiting both pro- and antitumoral effects. However, little is known yet about their contribution in PCa. This study investigated the phenotypic and functional profiles of ILC subsets in the peripheral blood mononuclear cells (PBMCs) of patients with PCa stratified by Gleason score.

Methods: PBMCs were isolated by Lymphoprep. ILC frequency and activity were evaluated by flow cytometry. The levels of ILC-activating cytokines were analyzed by multiplex assay in the serum of healthy donors (HDs) and patients with PCa. To evaluate the crosstalk between ILC2s and cancer cells, PC3 and DU145 human PCa cell lines were used.

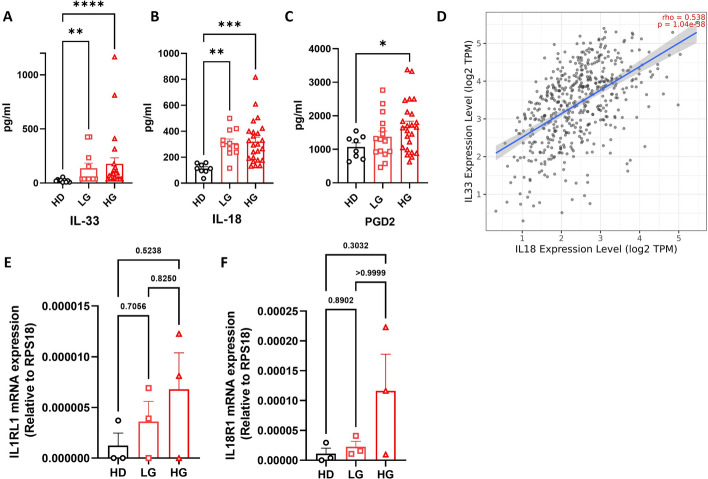
Results: We found a stage-dependent increase in the protumoral ILC2 frequency and a concurrent decrease in antitumoral ILC1s in patients with PCa compared with healthy controls. Interestingly, the frequency of ILC2s was higher in patients with elevated prostate-specific antigen (PSA) values, suggesting their potential as molecular predictor for defining the risk category of patients with PCa at diagnosis. Importantly, patients with PCa exhibited hyperactivated ILC2s, characterized by elevated interleukin (IL)-13 and IL-5 production, while ILC1s displayed reduced tumor necrosis factor (TNF)-α and interferon (IFN)-γ secretion. Furthermore, serum levels of ILC2-activating cytokines IL-33, IL-18, and prostaglandin D2 (PGD2) were elevated in patients with PCa. In vitro co-culture experiments demonstrated that PCa cell lines, capable of secreting these cytokines, could directly enhance ILC2 activity. Likewise, ILC2-derived IL-13 promoted PCa cell migration and invasion.

Conclusions: Collectively, our findings highlight a dysregulated ILC profile in PCa, characterized by ILC2 dominance and heightened activity at the expense of ILC1s, suggesting both ILC1s and ILC2s as potential therapeutic targets for PCa treatment.

Keywords: IL-13; IL-18; IL-33; ILC1s; ILC2s; Innate lymphoid cells; Prostate cancer.


Conflict of interest statement

Declarations. Ethics approval and consent to participate: Venous blood was drawn from HDs and patients with PCa at the University Hospital Federico II in Naples, between September 2021 and December 2023. This study was conducted in accordance with the Declaration of Helsinki (revised in 2013). The study protocol was approved by the Ethics Committee of the University Hospital Federico II in Naples (approval no. 180/20). All participants provided informed consent before participating in the study. For IHC, human prostate tissues were provided by the Tissue Bank Bern. Analyses of the samples were approved by the Cantonal Ethics Committee of Bern (200/2014 and 2024-02031). Consent for publication: Not applicable. Competing interests: The authors declare no potential competing interests.

Figures

Fig. 1
Fig. 1
ILCs are dysregulated in patients with PCa. A, C Representative examples of flow cytometry analysis of total ILCs (A) and ILC subsets (C) in PBMCs of HDs (n = 25) and patients with LG (n = 16) and HG (n = 32) PCa. BF Frequency of total ILCs (B), ILC1s (D), ILC2s (E), and ILCPs (F). Data shown as mean ± SEM (*p < 0.05; **p < 0.01; ***p < 0.001; ****p < 0.0001) and analyzed by Wilcoxon and/or one-way ANOVA tests
Fig. 2
Fig. 2
ILC2 frequency increases in patients with high PSA values and impacts patients’ survival. A Correlation of ILC1 and ILC2 frequencies in patients with PCa (n = 48). B, C Ratios of ILC2/ILC1 (B) and ILCP/ILC1 (C) in HDs and patients with LG and HG PCa . D Correlations between circulating ILC2 frequency and PSA value (n = 48). (E) Frequency of ILC2s based on PSA levels of HDs (< 4 (n = 25)) and patients with PCa (< 4 (n = 5), 4–10 (n = 28) and > 10 ng/ml (n = 15) according to the National Comprehensive Cancer Network guidelines. (F) Survival analysis (likelihood ratio test) of patients with PCa (TCGA), stratified according to their risk score for an ILC2 gene signature. Survival of patients was higher in low-risk score patients (blue line) compared with high-risk patients (red line). Data shown as mean ± SEM (*p < 0.05 **p < 0.01; ****p < 0.0001) and analyzed by Wilcoxon and/or one-way ANOVA tests
Fig. 3
Fig. 3
AC ILC activation is affected in patients with PCa. IL-33 (A), IL-18 (B), and PGD2 (C) concentrations (pg/ml) in sera of HDs (n = 8) and patients with LG (n = 11–15) and HG (n = 24) PCa. D. Correlation between IL-33 and IL-18 levels in PCa via TIMER database. E, F Expression of IL1RL1 (E) and IL18R1 (F) assessed by qPCR in freshly sorted ILC2s from HDs and patients with LG and HG PCa (n = 3). Data shown as mean ± SEM (*p < 0.05; **p < 0.01; ***p < 0.001; ****p < 0.0001) and analyzed by Wilcoxon and/or one-way ANOVA tests
Fig. 4
Fig. 4
ILC function is altered in patients with PCa. A, B. Representative example of flow cytometry analysis of ILC2-produced IL-13 (A) and IL-5 (B) in ex vivo PBMCs upon stimulation. C Frequencies of IL-13 and IL-5 positive ILC2s in ex vivo PBMCs from HDs (n = 8) and patients with LG (n = 10) and HG (n = 22) PCa upon stimulation. D, E Representative example of flow cytometry analysis of ILC1-produced TNF-α (D) and IFN-γ (E) in ex vivo PBMCs upon stimulation. F Frequencies of IFN-γ- and TNF-α-positive ILC1s in ex vivo PBMCs from HDs (n = 8) and patients with LG (n = 10) and HG (n = 22) PCa upon stimulation. G Quantification of type 2 cytokines assessed by Legendplex analysis in sera of HDs (n = 12) and patients with LG (n = 13) and HG (n = 29) PCa. H Disease-free survival of patients with PCa stratified on the basis of high (red) and low (blue) IL-13 expression. Data shown as mean ± SEM (*p < 0.05; ***p < 0.001; ****p < 0.0001) and analyzed by Wilcoxon and/or one-way ANOVA tests
Fig. 5
Fig. 5
PCa cell conditioned medium (CM) recapitulates observations in patients. A, B Prostate cancer cell line mRNA expression of IL-33 (A) and IL-18 (B) via GEDS platform. C Representative example of flow cytometry analysis of ILC subsets in HD PBMCs cultivated with or without PC3 conditioned media (CM). D Frequency of ILC subsets in HD PBMCs (n = 10) incubated with or without PC3 CM. E Representative example of flow cytometry analysis of IL-13- and IL-5-positive cell populations in HD PBMCs incubated with or without PC3 conditioned media. F Frequencies of IL-13- and IL-5-positive ILC2s in ex vivo PBMCs upon incubation with or without PC3 conditioned media (n = 7). Data shown as mean ± SEM (*p < 0.05 versus CTR) and analyzed by Wilcoxon and/or one-way ANOVA tests
Fig. 6
Fig. 6
ILC2-derived IL-13 promotes PCa cell migration and invasion. A, B Prostate cancer cell line mRNA expression of IL13RA1 (A) and IL13RA2 (B) receptors via GEDS platform. C Representative example of a wound healing assay (20× magnification) performed using PC3 cancer cells after incubation with ILC2 CM or ILC2 CM + anti-IL-13 blocking antibody. D Quantification of the healed wound area at 24 and 48 h. E, F Representative example (E) and quantification (F) of clonogenic assays performed using PC3 cancer cells after incubation with ILC2 CM or ILC2 CM + anti-IL-13 blocking antibody for 10 days. G, H Expression of MMP9 (G) and MMP2 (H) assessed by qPCR analysis in PC3 cancer cells upon incubation with ILC2 CM or ILC2 CM + anti-IL-13 blocking antibody. Data shown as mean ± SEM (*p < 0.05; **p < 0.01; ***p < 0.001) and analyzed by Wilcoxon and/or one-way ANOVA tests
Fig. 7
Fig. 7
ILC2s are enriched in PCa tissues. A Consecutive sections of HG PCa tissue were double stained for IL-33 and GATA3 (representative samples depicted) or for IL-33 and CD3. Arrows indicate tumor areas with immune foci containing ILC2, recognized as GATA3+ CD3 lymphocytes. Scale bar: 1000 μm. B Magnified view of the area marked by the red arrow showing the indicated double stainings on consecutive sections. GATA3+ CD3 lymphocytes are visible in the center of the immune foci. Scale bar: 50 μm. CH Analysis of single-cell RNA sequencing (scRNA-seq) data from a publicly available PCa dataset. C UMAP plot highlighting ILC2, defined as PTPRC+GATA3+ CD3 (blue dots). D Comparison of the abundance (% of total cells) of ILC2s in high-grade (HG) versus low-grade (LG) PCa tissues. E UMAP plot showing IL33-expressing cells, with a blue–yellow scale indicating IL-33 RNA expression levels. F Quantification of IL-33-expressing cells in HG and LG PCa tissues. G UMAP plot showing IL-18-expressing cells, with a blue–yellow scale indicating IL-18 RNA expression levels. H Quantification of IL18-expressing cells in HG and LG PCa tissues

References

    1. Sung H, Ferlay J, Siegel RL, Laversanne M, Soerjomataram I, Jemal A, et al. Global cancer statistics 2020: GLOBOCAN estimates of incidence and mortality worldwide for 36 cancers in 185 countries. CA Cancer J Clin. 2021;71:209–49. - PubMed
    1. Stamey TA, Yang N, Hay AR, McNeal JE, Freiha FS, Redwine E. Prostate-specific antigen as a serum marker for adenocarcinoma of the prostate. N Engl J Med. 1987;317:909–16. - PubMed
    1. Catalona WJ, Hudson MA, Scardino PT, Richie JP, Ahmann FR, Flanigan RC, et al. Selection of optimal prostate specific antigen cutoffs for early detection of prostate cancer: receiver operating characteristic curves. J Urol. 1994;152:2037–42. - PubMed
    1. McNally CJ, Ruddock MW, Moore T, McKenna DJ. Biomarkers that differentiate benign prostatic hyperplasia from prostate cancer: a literature review. Cancer Manag Res. 2020;12:5225–41. - PMC - PubMed
    1. Dalton DL. Elevated serum prostate-specific antigen due to acute bacterial prostatitis. Urology. 1989;33:465. - PubMed