The conclusiveness of trial sequential analysis varies with estimation of between-study variance: a case study
- PMID: 40247168
- PMCID: PMC12004556
- DOI: 10.1186/s12874-025-02545-x
The conclusiveness of trial sequential analysis varies with estimation of between-study variance: a case study
Abstract
Background: Trial sequential methods have been introduced to address issues related to increased likelihood of incorrectly rejecting the null hypothesis in meta-analyses due to repeated significance testing. Between-study variance (τ2) and its estimate ( 2) play a crucial role in both meta-analysis and trial sequential analysis with the random-effects model. Therefore, we investigated how different 2 impact the results of and quantities used in trial sequential analysis.
Methods: This case study was grounded in a Cochrane review that provides data for smaller (< 10 randomized clinical trials, RCTs) and larger (> 20 RCTs) meta-analyses. The review compared various outcomes between video-laryngoscopy and direct laryngoscopy for tracheal intubation, and we used outcomes including hypoxemia and failed intubation, stratified by difficulty, expertise, and obesity. We calculated odds ratios using inverse variance method with six estimators for τ2, including DerSimonian-Laird, restricted maximum-likelihood, Paule-Mandel, maximum-likelihood, Sidik-Jonkman, and Hunter-Schmidt. Then we depicted the relationships between 2 and quantities in trial sequential analysis including diversity, adjustment factor, required information size (RIS), and α-spending boundaries.
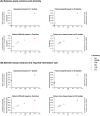
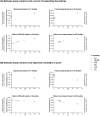
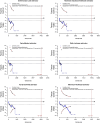
Results: We found that diversity increases logarithmically with 2, and that the adjustment factor, RIS, and α-spending boundaries increase linearly with 2. Also, the conclusions of trial sequential analysis can differ depending on the estimator used for between-study variance.
Conclusion: This study highlights the importance of 2 in trial sequential analysis and underscores the need to align the meta-analysis and the trial sequential analysis by choosing estimators to avoid introducing biases and discrepancies in effect size estimates and uncertainty assessments.
Keywords: Heterogeneity; Meta-analysis; Optimal information size; Required information size; Sequential method; Tau-square.
© 2025. The Author(s).
Conflict of interest statement
Declarations. Ethics approval and consent to participate: Not applicable. Consent for publication: Not applicable. Competing interests: The authors declare no competing interests.
Figures


Similar articles
-
Methods for estimating between-study variance and overall effect in meta-analysis of odds ratios.Res Synth Methods. 2020 May;11(3):426-442. doi: 10.1002/jrsm.1404. Epub 2020 Apr 13. Res Synth Methods. 2020. PMID: 32112619
-
A comparison of heterogeneity variance estimators in simulated random-effects meta-analyses.Res Synth Methods. 2019 Mar;10(1):83-98. doi: 10.1002/jrsm.1316. Epub 2018 Sep 6. Res Synth Methods. 2019. PMID: 30067315
-
An empirical comparison of heterogeneity variance estimators in 12 894 meta-analyses.Res Synth Methods. 2015 Jun;6(2):195-205. doi: 10.1002/jrsm.1140. Epub 2015 Jun 6. Res Synth Methods. 2015. PMID: 26053175
-
Indirect laryngoscopy is more effective than direct laryngoscopy when tracheal intubation is performed by novice operators: a systematic review, meta-analysis, and trial sequential analysis.Can J Anaesth. 2024 Feb;71(2):201-212. doi: 10.1007/s12630-023-02642-9. Epub 2023 Nov 21. Can J Anaesth. 2024. PMID: 37989942 Free PMC article.
-
Effects of sniffing position for tracheal intubation: a meta-analysis of randomized controlled trials.Am J Emerg Med. 2015 Nov;33(11):1606-11. doi: 10.1016/j.ajem.2015.06.049. Epub 2015 Jun 23. Am J Emerg Med. 2015. PMID: 26227445 Review.
References
-
- Lau J, Antman EM, Jimenez-Silva J, Kupelnick B, Mosteller F, Chalmers TC. Cumulative meta-analysis of therapeutic trials for myocardial infarction. N Engl J Med. 1992;327(4):248–54. 10.1056/nejm199207233270406. - PubMed
-
- Lau J, Schmid CH, Chalmers TC. Cumulative meta-analysis of clinical trials builds evidence for exemplary medical care. J Clin Epidemiol. 1995;48(1):45–57; discussion 9–60. 10.1016/0895-4356(94)00106-z. - PubMed
-
- Wetterslev J, Thorlund K, Brok J, Gluud C. Trial sequential analysis may establish when firm evidence is reached in cumulative meta-analysis. J Clin Epidemiol. 2008;61(1):64–75. 10.1016/j.jclinepi.2007.03.013. - PubMed
-
- Armitage P. Sequential analysis in therapeutic trials. Annu Rev Med. 1969;20:425–30. 10.1146/annurev.me.20.020169.002233. - PubMed
-
- Pocock SJ. Group sequential methods in the design and analysis of clinical trials. Biometrika. 1977;64(2):191–9.
MeSH terms
LinkOut - more resources
Full Text Sources

