. 2025 Apr 17;23(1):301.
doi: 10.1186/s12951-025-03376-0.

Lactobacillus acidophilus extracellular vesicles-coated UiO-66-NH2@siRNA nanoparticles for ulcerative colitis targeted gene therapy and gut microbiota modulation

Affiliations

Lactobacillus acidophilus extracellular vesicles-coated UiO-66-NH2@siRNA nanoparticles for ulcerative colitis targeted gene therapy and gut microbiota modulation

Chenyang Cui et al. J Nanobiotechnology. .

Erratum in

Abstract

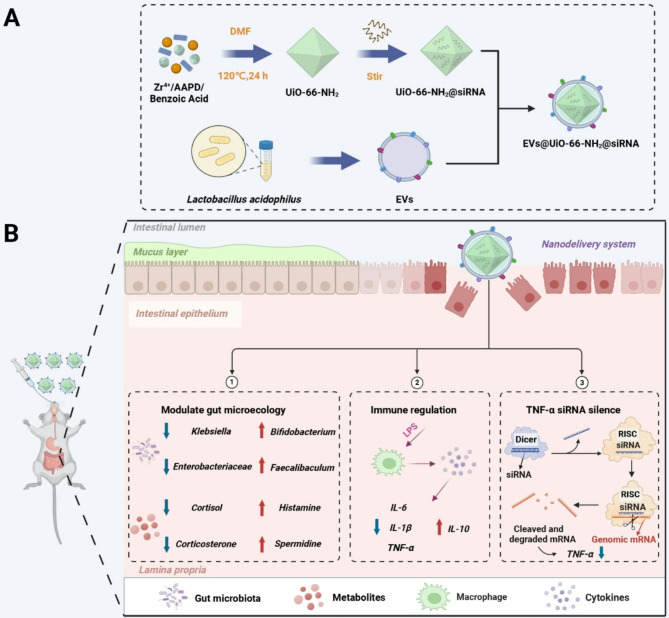
Ulcerative colitis (UC) is a complex and chronic inflammatory bowel disease whose pathogenesis involves genetic and environmental factors, which poses a challenge for treatment. Here, we have designed an innovative integrated therapeutic strategy using Lactobacillus acidophilus extracellular vesicles (EVs) to encapsulate UiO-66-NH2 nanoparticles bounded with TNF-α siRNA (EVs@UiO-66-NH2@siRNA) for UC treatment. This system shows superior affinity to inflammation-related cells due to the Lactobacillus acidophilus EVs can maintain immune homeostasis by regulating the secretion of cytokines in vitro. siRNA can specifically target the key inflammatory TNF-α in UC and silence its gene expression, thereby regulating the process of inflammatory response. After oral administration, EVs@UiO-66-NH2@siRNA demonstrates an accurate delivery of TNF-α siRNA to colonize the colon site and exerts a siRNA therapeutic effect by inhibiting the expression of TNF-α, which alleviates the intestinal inflammation in DSS-induced UC model. Moreover, this system can modulate the types and compositional structures of gut microbiota and metabolites to achieve an anti-inflammatory phenotype, which is helpful for the repair of intestinal homeostasis. We also have proved that UiO-66-NH2 nanoparticles exhibit a high loading capacity for TNF-α siRNA and good pH responsiveness, improving the potent release of siRNA in colon tissue. Collectively, the EVs@UiO-66-NH2@siRNA nano-delivery system demonstrate a feasible combination therapeutic strategy for UC through gut microecology modulation, immune regulation and TNF-α siRNA silence, which may provide a potential targeted treatment approach for inflammatory bowel disease.

Keywords: Lactobacillus acidophilus EVs; TNF-α SiRNA; Targeted gene therapy; UiO-66-NH2; Ulcerative colitis.


Conflict of interest statement

Declarations. Ethics approval and consent to participate: All animal experiments were conducted under the Regional Ethics Committee for Animal Experiments at Zhengzhou University. Competing interests: The authors declare no competing interests.

Figures

Scheme 1
Scheme 1
EVs@UiO-66-NH2@siRNA nano-delivery system for the treatment of UC. (A) Preparation process of EVs@UiO-66-NH2@siRNA. (B) EVs@UiO-66-NH2@siRNA specifically treat UC
Fig. 1
Fig. 1
Preparation and characterization of EVs@UiO-66-NH2@siRNA. (A) Representative TEM images (scale = 100 nm) of EVs, UiO-66-NH2, UiO-66-NH2@siRNA, and EVs@UiO-66-NH2@siRNA. (B) HAADF-STEM image of EVs@UiO-66-NH2@siRNA and elemental mapping of N, O, P, and Zr (Scale bar = 100 nm). (C) XRD spectra of UiO-66-NH2 and UiO-66-NH2@siRNA. (D) N2 adsorption-desorption isotherms of UiO-66-NH2 and UiO-66-NH2@siRNA. (E and F) Size and zeta potential of EVs, UiO-66-NH2, UiO-66-NH2@siRNA, and EVs@UiO-66-NH2@siRNA (n = 3). (G) Encapsulation efficiency of siRNA in EVs@UiO-66-NH2@siRNA (n = 3). (H) Time-dependent release of siRNA from EVs@UiO-66-NH2@siRNA at pH 3.0, pH 5.0, and pH 7.4 (n = 3). (I) Stability of UiO-66-NH2@siRNA and EVs@UiO-66-NH2@siRNA in serum (n = 3). (J and K) Degradation profiles over time of siRNA and EVs@UiO-66-NH2@siRNA in RNase and serum. (L) SDS-PAGE protein analysis of UiO-66-NH2, EVs, and EVs@UiO-66-NH2@siRNA (1: UiO-66-NH2, 2: EVs, 3: EVs@UiO-66-NH2@siRNA)
Fig. 2
Fig. 2
Cellular internalization of EVs@UiO-66-NH2@siRNA. (A-D) Laser confocal images and green fluorescence quantification of single RAW264.7 cells after co-incubation with UiO-66-NH2@siRNA and EVs@UiO-66-NH2@siRNA for 3 h, 7 h, and 12 h. Scale bar = 4.35 μm. The blue channel shows the cell nuclei labeled with DAPI. The red channel shows lysosomes labeled with Lyso-Tracker. The green channel displays siRNA labeled with FAM. (E and F) Quantitative analysis of green fluorescence in RAW264.7 cells after co-incubation with UiO-66-NH2@siRNA and EVs@UiO-66-NH2@siRNA for 3 h, 7 h, and 12 h using flow cytometry (n = 3). Data are presented as mean ± SD. *** P < 0.001
Fig. 3
Fig. 3
Anti-inflammatory effects of EVs@UiO-66-NH2@siRNA in vitro. (A) After treatment of RAW264.7 cells with siRNA, UiO-66-NH2, EVs, EVs@UiO-66-NH2, UiO-66-NH2@siRNA, and EVs@UiO-66-NH2@siRNA, cell viability was assessed using the MTT method (n = 5). (B-D) Following treatment with different nanoparticles, the levels of TNF-α, IL-6, IL-1β, and IL-10 in cells were measured using ELISA (n = 5). Data are presented as mean ± SD. * P < 0.05, ** P < 0.01, *** P < 0.001
Fig. 4
Fig. 4
Distribution of EVs@UiO-66-NH2@siRNA in the gastrointestinal tract. (A) Distribution of free Cy5.5-siRNA, UiO-66-NH2@Cy5.5-siRNA, and EVs@UiO-66-NH2@Cy5.5-siRNA, in the gastrointestinal tract of mice 24 h following oral administration. (B) Distribution of the three types of nanoparticles in other major organs (heart, liver, spleen, lung, kidney). (C) Quantitative analysis of Cy5.5 fluorescence signals in colon tissues after oral administration of the three types of nanoparticles for 24 h (n = 3). Data are presented as means ± SD. * P < 0.05, ** P < 0.01, *** P < 0.001
Fig. 5
Fig. 5
Anti-inflammatory effects of EVs@UiO-66-NH2@siRNA in vivo. (A) Schematic representation of the experimental design. (B) Changes in body weight of each group of mice over 13 days (n = 5). (C) Changes in disease activity index of each group of mice over 13 days (n = 5). (D) Images of colon tissues. (E) Statistical analysis of colon lengths (n = 5). (F) Representative images of spleens. (G) Changes in spleen index (n = 5). (H-K) Quantitative RT-PCR analysis of relative mRNA expression levels of TNF-α, IL-6, IL-1β, and IL-10 in colon tissues (n = 5). (L-O) ELISA detection of TNF-α, IL-6, IL-1β, and IL-10 levels in colon tissues (n = 5). (P) Representative H&E-stained images of colon tissues at the end of treatment (scale bar = 20 μm). Data were presented as mean ± SD. * P < 0.05, ** P < 0.01, *** P < 0.001
Fig. 6
Fig. 6
Regulation of gut microbiota and metabolite by EVs@UiO-66-NH2@siRNA. Comparison of microbial α-diversity assessed by (A) Chao1 index, (B) Shannon index and (C) Simpson index. (D) Principal component (PC) analysis plot illustrating the diversity of microbiota. (E) Column diagram of the relative abundance of gut microbiome at the phylum level. (F) Linear discriminant analysis effect (LEfSe) size illustrating differences in gut microbiota taxa for the DSS group versus the EVs@UiO-66-NH2@siRNA group. (G) Distribution histogram based on linear discriminant analysis (LDA). LDA (log10) > 3.0. (H-I) The relative abundance of changes in representative bacterial taxa (H) Klebsiella, (I) Enterobacteriaceae, (J) Bifidobacterium and (K) Faecalibaculum. (L) Volcano plot of the differential metabolites, wherein each point represents a metabolite. Significantly up-regulated metabolites are indicated by red points and significantly down-regulated metabolites are indicated by green points and no difference metabolites are indicated by gray points. (M) Heat map of the differential metabolite clustering in the DSS group and EVs@UiO-66-NH2@siRNA group. (N-Q) The relative abundance of changes in representative differential metabolite (N) histamine, (O) spermidine, (P) cortisol and (Q) corticosterone. (R) KEGG enrichment plot of the differential metabolites in the DSS group and EVs@UiO-66-NH2@siRNA group. Data are presented as mean ± SD. * P < 0.05, ** P < 0.01, *** P < 0.001
Fig. 7
Fig. 7
Biocompatibility study of EVs@UiO-66-NH2@siRNA. (A) Representative H&E staining of major organs and (B) TUNEL fluorescence staining. Scale bar = 20 μm
None

References

    1. Gros B, Kaplan GG. Ulcerative colitis in adults: A review. JAMA. 2023;330:951–65. - PubMed
    1. Adams A, Gupta V, Mohsen W, Chapman TP, Subhaharan D, Kakkadasam Ramaswamy P, Kumar S, Kedia S, McGregor CG, Ambrose T, et al. Early management of acute severe UC in the biologics era: development and international validation of a prognostic clinical index to predict steroid response. Gut. 2023;72:433–42. - PubMed
    1. Franzosa EA, Sirota-Madi A, Avila-Pacheco J, Fornelos N, Haiser HJ, Reinker S, Vatanen T, Hall AB, Mallick H, McIver LJ, et al. Gut Microbiome structure and metabolic activity in inflammatory bowel disease. Nat Microbiol. 2019;4:293–305. - PMC - PubMed
    1. Chen Y, Mai Q, Chen Z, Lin T, Cai Y, Han J, Wang Y, Zhang M, Tan S, Wu Z, et al. Dietary palmitoleic acid reprograms gut microbiota and improves biological therapy against colitis. Gut Microbes. 2023;15:2211501. - PMC - PubMed
    1. Yang W, Cong Y. Gut microbiota-derived metabolites in the regulation of host immune responses and immune-related inflammatory diseases. Cell Mol Immunol. 2021;18:866–77. - PMC - PubMed

MeSH terms

Substances

LinkOut - more resources