. 2025 Jun 1;328(6):H1147-H1167.
doi: 10.1152/ajpheart.00661.2024. Epub 2025 Apr 17.

Sustained tenascin-C expression drives neointimal hyperplasia and promotes aortocaval fistula failure

Affiliations

Sustained tenascin-C expression drives neointimal hyperplasia and promotes aortocaval fistula failure

Luis A Gonzalez et al. Am J Physiol Heart Circ Physiol. .

Abstract

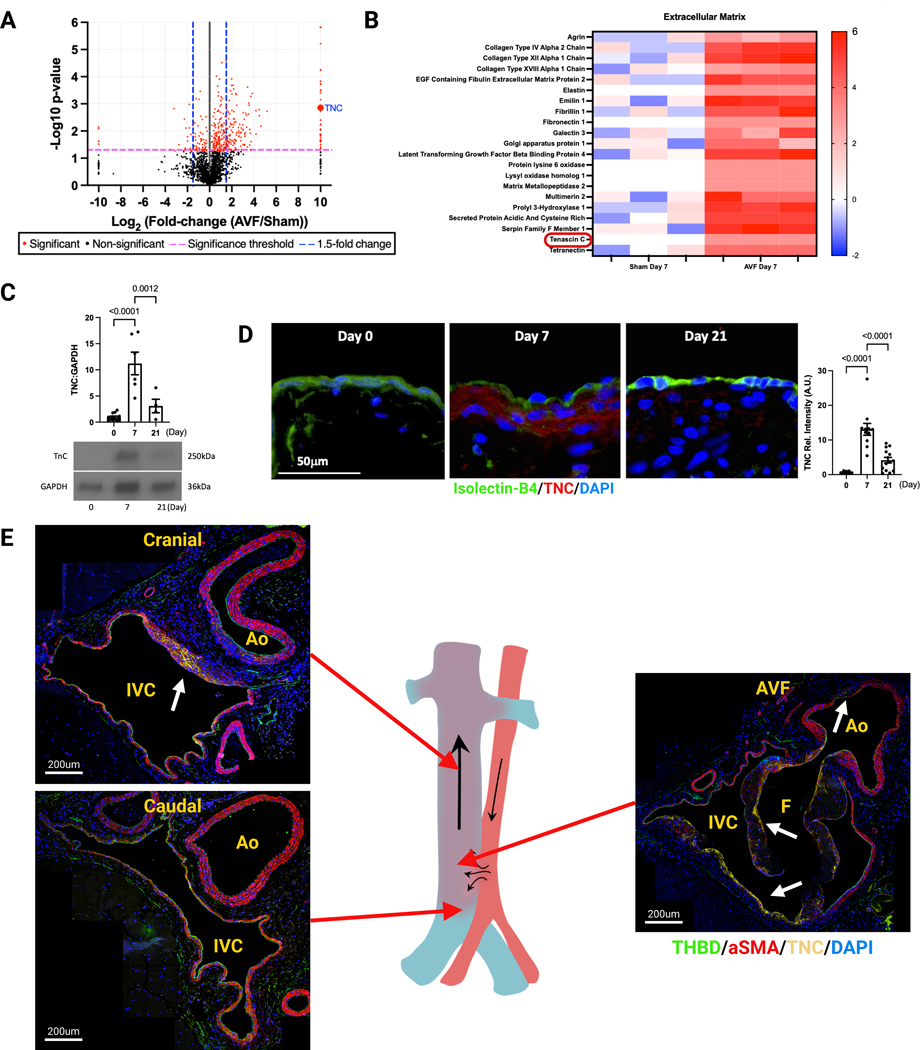
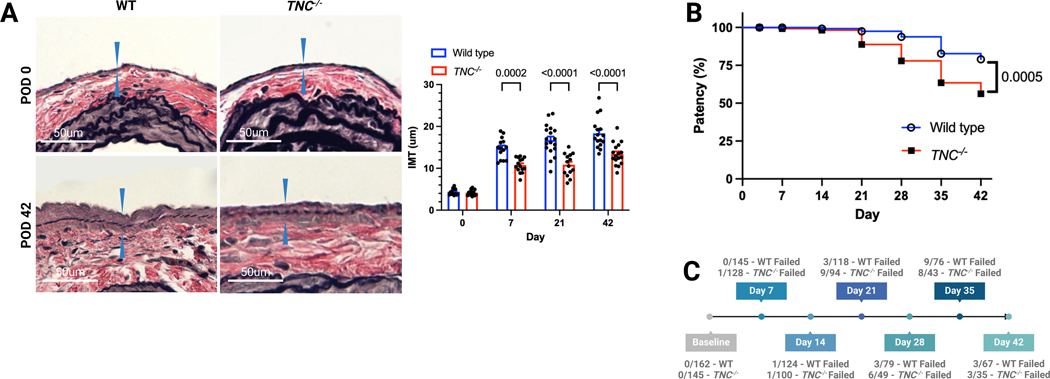
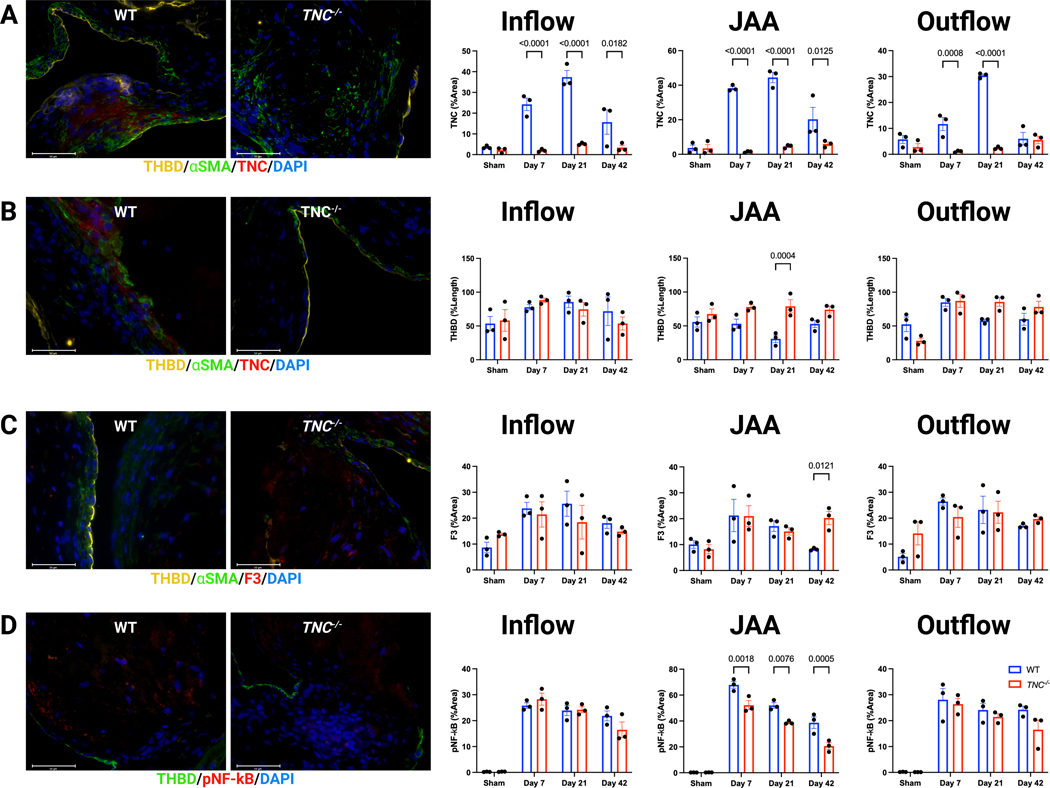
End-stage kidney disease (ESKD) impacts over 740,000 individuals in the United States, with many patients relying on arteriovenous fistulae (AVF) for hemodialysis due to superior patency and reduced infections. However, AVF patency is reduced by thrombosis and neointimal hyperplasia, yielding a 1-yr patency of only 40%-50%. We hypothesized that tenascin-C (TNC), a regulator of inflammation and immune responses after injury, also regulates venous remodeling during AVF maturation. AVF were created in wild-type (WT) and Tnc knockout (Tnc-/-) mice, and proteomic analyses were conducted to identify protein changes between sham and AVF WT tissue. Immunofluorescence and Western blot assays compared venous tissue from WT and Tnc-/- mice. In vitro studies using human umbilical vein endothelial cells and human umbilical vein smooth muscle cells examined TNC-siRNA effects on thrombomodulin (THBD) and NF-κB. Macrophages from WT and Tnc-/- mice were assessed for anti-inflammatory phenotype polarization and tissue factor expression. TNC expression was spatially and temporally regulated in WT mice with AVF, and TNC colocalized with matrix remodeling but not with THBD expression; TNC expression was downregulated in patent AVF but sustained in occluded AVF, both in WT mice and human AVF specimens. Tnc-/- mice had reduced AVF patency, less wall thickening, and increased thrombosis, with increased THBD expression. In vitro, TNC-siRNA increased THBD and reduced NF-κB activation. Macrophages from Tnc-/- mice showed increased anti-inflammatory macrophage polarization and tissue factor expression, facilitating thrombosis. Sustained TNC expression drives neointimal hyperplasia and AVF failure by promoting a prothrombotic, inflammatory microenvironment. Targeting TNC pathways may enhance AVF patency and improve dialysis outcomes.NEW & NOTEWORTHY This study identifies Tenascin-C (TNC) as a key regulator of arteriovenous fistula (AVF) patency. TNC is spatially and temporally regulated, driving neointimal hyperplasia and thrombosis by promoting a prothrombotic, inflammatory microenvironment. In Tnc-/- mice, reduced TNC expression increased thrombomodulin and anti-inflammatory macrophage polarization but impaired wall thickening and AVF patency. These findings link sustained TNC expression to AVF failure and suggest that targeting TNC pathways could enhance AVF outcomes in patients requiring hemodialysis.

Keywords: arteriovenous fistulae; tenascin-C; thrombomodulin; thrombosis; venous remodeling.


Conflict of interest statement

Disclosure:

The authors have declared that no conflict of interest exists.

Figures

Figure 1.
Figure 1.. Spatial and Temporal Induction of Tenascin-C Expression.
A. Volcano plot showing 2428 distinct proteins that were identified in arteriovenous fistula (AVF) harvested on post-op day (POD) 7. The x-axis shows the log2(Fold-change) values, and the y-axis shows the -log10(p-values) values. The blue vertical dashed lines show ±1.5-fold change. B. Heatmap shows significantly differentially expressed proteins between Sham and AVF (Student t-test, FDR ≤1%; S0 = 2; n = 3; male). Each column represents an individual sham or AVF sample from a unique mouse. The z-score represents the difference in regulation with red indicating upregulation and blue indicating downregulation. Heatmaps are organized by proteins implicated in extracellular matrix (ECM). C. Representative Western-blot analysis of Tenascin-C (TNC) and GAPDH labeling in AVF at POD 0, 7, and 21. Bar graph shows relative densitometry of TNC. n=4–12, male, (ANOVA). D. Representative photomicrographs showing immunohistochemistry of Isolectin-B4 (green), TNC (red), and DAPI (blue) in the AVF wall at POD 0, 7, and 21. Bar graph shows intensity of TNC in the AVF wall. n=5–14, male, (One-way ANOVA). E. Representative photomicrographs showing immunohistochemistry of thrombomodulin (THBD; green), αSMA (red), TNC (yellow), and DAPI (blue) following AVF creation caudal to the level of the fistula, at the fistula, and cranial to the level of the fistula. IVC, inferior vena cava; Ao, aorta; F, fistula.
Figure 2.
Figure 2.. Increased Tenascin-C Expression in Occluded Human and Mouse Fistulae.
A. Representative micrographs of Elastin van Gieson staining comparing patent vs occluded AVF. B. Representative photomicrograph of THBD (green), TNC (red), and DAPI (blue) in patent or occluded murine AVF tissue. Bar graph shows %Area of TNC in the AVF. n=4–6, 3 male, 4 female (t-test). IVC, inferior vena cava; Ao, aorta; F, fistula; arrow pointing at fistula lumen. C. Representative photomicrographs of THBD (green), pNF-κB (red), and DAPI (blue) in patent or occluded murine AVF tissue. Bar graph shows %Area of pNF-κB in the AVF, n=5–6, 3 male, 3 female (t-test).D. Representative photomicrographs of THBD (yellow), Tissue factor (F3; red), αSMA (green), and DAPI (blue) in patent or occluded murine AVF tissue. Bar graph shows %Area of F3 in the AVF. n=5–6, 3 male, 3 female (t-test); bar graph shows %Length of THBD in the AVF intimal layer, n=6–7, 3 male, 4 female (t-test); E. Representative photomicrographs of αSMA (green), TNC (red), and DAPI (blue) in patent or occluded human AVF tissue. Bar graph shows %Area of TNC in the AVF. n=4, 4 male (t-test). L, lumen. F. Representative photomicrographs of THBD (green), pNF-κB (red), and DAPI (blue) in patent or occluded human AVF tissue. Bar graph shows %Area of pNF-κB in the AVF, n=4, (t-test). G. Representative photomicrographs of THBD (green), F3 (red), and DAPI (blue) in patent or occluded human AVF tissue. Bar graph shows %Area of F3 in the AVF, n=4, (t-test); bar graph shows %Length of THBD in the AVF intimal layer. n=4, (t-test).
Figure 3.
Figure 3.. Tenascin-C Expression Activates NF-κB Signaling, Resulting in Reduced THBD Levels.
A. Human umbilical vein endothelial cells (HUVEC) were treated with either scramble or TNC siRNA. Bar graph show relative number of TNC mRNA transcripts in HUVEC cells, n=9–15, (t-test); bar graph show relative number of RELA mRNA transcripts in HUVEC cells, n=9, (t-test); bar graph show relative number of KLF2 mRNA transcripts in HUVEC cells, n=8–9, (t-test); bar graph show relative number of THBD mRNA transcripts in HUVEC cells, n=9–15, (t-test); bar graph show relative number of F3 mRNA transcripts in HUVEC cells, n=3, p=0.7549 (t-test). B. Human umbilical vein smooth muscle cells (HUVSMC) were treated with either scramble or TNC siRNA. Bar graph show relative number of TNC mRNA transcripts in HUVSMC cells, n=6, (t-test); bar graph show relative number of RELA mRNA transcripts in HUVSMC cells, n=3, p=0.5818 (t-test); bar graph show relative number of KLF2 mRNA transcripts in HUVSMC cells, n=3, p=0.6032 (t-test); bar graph show relative number of THBD mRNA transcripts in HUVSMC cells, n=6, p=0.4517 (t-test); bar graph show relative number of F3 mRNA transcripts in HUVSMC cells, n=6, (t-test). C. HUVEC cells were treated with either scramble or TNC siRNA. Representative western blot of TNC, pNF-κB, NF-κB, THBD, and GAPDH in HUVEC cells. Bar graph shows relative densitometry of TNC, n=4, (t-test); bar graph shows relative densitometry of pNF-κB:NF-κB, n=4, (t-test); bar graph shows relative densitometry of THBD, n=4, (t-test). D. HUVSMC cells were treated with either scramble or TNC siRNA. Representative western blot of TNC, pNF-κB, NF-κB, THBD, and GAPDH in HUVEC cells. Bar graph shows relative densitometry of TNC, n=3, (t-test); bar graph shows relative densitometry of pNF-κB:NF-κB, n=3, p=0.6385 (t-test); bar graph shows relative densitometry of THBD, n=3, p=0.9368 (t-test). E. HUVEC cells were treated with either vehicle or 2ug/mL of full-length TNC. Bar graph show relative number of TNC mRNA transcripts in HUVEC cells, n=12–15, (t-test); bar graph show relative number of RELA mRNA transcripts in HUVEC cells, n=6–9, (t-test); bar graph show relative number of KLF2 mRNA transcripts in HUVEC cells, n=6–9, (t-test); bar graph show relative number of THBD mRNA transcripts in HUVEC cells, n=12–15, (t-test); bar graph show relative number of F3 mRNA transcripts in HUVEC cells, n=6, p=0.5875 (t-test). F. HUVSMC cells were treated with either vehicle or 2ug/mL of full-length TNC. Bar graph show relative number of TNC mRNA transcripts in HUVSMC cells, n=6, p=0.0977 (t-test); bar graph show relative number of RELA mRNA transcripts in HUVSMC cells, n=6, p=4965 (t-test); bar graph show relative number of KLF2 mRNA transcripts in HUVSMC cells, n=3, p=0.1951 (t-test); bar graph show relative number of THBD mRNA transcripts in HUVSMC cells, n=12–15, p=0.0002 (t-test); bar graph show relative number of F3 mRNA transcripts in HUVSMC cells, n=6, p=0.5632 (t-test). G. HUVEC cells were treated with either vehicle or 2ug/mL of full-length TNC. Representative western blot of TNC, pNF-κB, NF-κB, THBD, and GAPDH in HUVEC cells. Bar graph shows relative densitometry of TNC, n=4, (t-test); bar graph shows relative densitometry of pNF-κB:NF-κB, n=4, p=0.1228 (t-test); bar graph shows relative densitometry of THBD, n=4, p=0.4483 (t-test). H. HUVSMC cells were treated with either vehicle or 2ug/mL of full-length TNC. Representative western blot of TNC, pNF-κB, NF-κB, THBD, and GAPDH in HUVEC cells. Bar graph shows relative densitometry of TNC, n=3, (t-test); bar graph shows relative densitometry of pNF-κB:NF-κB, n=3, p=0.6981 (t-test); bar graph shows relative densitometry of THBD, n=3, p=0.7946 (t-test).
Figure 4.
Figure 4.. Tnc−/− mice exhibit reduced patency without compromised outward remodeling or increased wall thickening.
A. Representative micrographs of Elastin van Gieson staining showing wall thickness (denoted by blue arrowheads) of baseline and AVF POD 42. Bar graph shows intimal-medial thickness quantification. n=14–17, (ANOVA). B. Kaplan-Meier curve showing AVF patency among WT and Tnc−/− mice. n=35–162, p= 0.0007 (Log-rank test), p=0.0005 (Gehan-Breslow-Wilcoxon test). Data points were collected longitudinally throughout the study, with some animals’ measurements recorded at all time points until sacrifice. C. Experimental overview showing the total number of mice and the number of failed AVF at each timepoint. WT; 87 male, 75 female. Tnc−/− 77 male, 68 female.
Figure 5.
Figure 5.. Absence of Tenascin-C Correlates with Elevated Tissue Factor and THBD Levels.
A. Representative photomicrographs of THBD (yellow), αSMA (green), TNC (red), and DAPI (blue) in WT vs Tnc−/− AVF. Bar graph shows %Area of TNC at the level of inflow, n=3, (ANOVA); juxta-anastomotic region, n=3, (ANOVA), and outflow, n=3, (ANOVA). B. Representative photomicrographs of THBD (yellow), αSMA (green), TNC (red), and DAPI (blue) in WT vs Tnc−/− AVF. Bar graph shows %Length of THBD in the intimal layer at the level of inflow, n=3, (ANOVA); juxta-anastomotic region, n=3, (ANOVA), and outflow, n=3, (ANOVA). C. Representative photomicrographs of THBD (yellow), αSMA (green), F3 (red), and DAPI (blue) in WT vs Tnc−/− AVF. Bar graph shows %Area of F3 at the level of inflow, n=3, (ANOVA); juxta-anastomotic region, n=3, (ANOVA), and outflow, n=3, (ANOVA). D. Representative photomicrographs of THBD (yellow), pNF-κB (red), and DAPI (blue) in WT vs Tnc−/− AVF. Bar graph shows %Area of pNF-κB at the level of inflow, n=3, (ANOVA); juxta-anastomotic region, n=3, (ANOVA), and outflow, n=3, (ANOVA). Conducted in male mice.
Figure 6.
Figure 6.. Loss of TNC Leads to Elevated Tissue Factor Levels and Accelerated Thrombus Formation.
A. Representative photomicrographs showing Martius Scarlet Blue staining of occluded WT vs Tnc−/− AVF. Bar graph shows percentage of RBC, n=3–6, (t-test); Fibrin, n=4–8, (t-test) in occluded AVF area. B. Representative photomicrographs of αSMA (green), TNC (red), and DAPI (blue) in occluded WT vs Tnc−/− AVF. Bar graph shows %Area of TNC, n=5, 2 male, 3 female, (t-test). C. Representative photomicrographs of αSMA (green), F3 (red), THBD (yellow), and DAPI (blue) in occluded WT vs Tnc−/− AVF tissue. Bar graph shows %Length of THBD in the AVF intimal layer, n=5, (t-test); bar graph shows %Area of F3 in the AVF, n=5, 2 male, 3 female, (t-test). D. Representative photomicrographs of THBD (green), pNF-κB (red), and DAPI (blue) in occluded WT vs Tnc−/− AVF. Bar graph shows %Area of pNF-κB, n=5, 2 male, 3 female, (t-test).
Figure 7.
Figure 7.. AVF Creation Induces Macrophage Expansion, with a Predominant Anti-Inflammatory Subtype in Tnc−/− Mice at Post-op Day 7.
A. Representative photomicrographs of iNOS (green), CD68 (red), CD31 (yellow) and DAPI (blue) in WT vs Tnc−/− AVF wall POD 7. B. Representative photomicrographs of CD206 (green), CD68 20 (red), CD31 (yellow) and DAPI (blue) in the outflow of WT vs Tnc−/− AVF wall POD 7. C. Bar graph at the juxta-anastomotic region shows CD68+ cells per high power field of the AVF wall, n=4–6, p=0.3932 (t-test); bar graph shows CD68+CD206+ cells per high power field of the AVF wall, n=4–6, (t-test); bar graph shows CD68+iNOS+ cells per high power field of the AVF wall, n=4–6, (t-test). D. Bar graph at the outflow region shows CD68+ cells per high power field of the AVF wall, n=4–6, p=0.0963 (t-test); bar graph shows CD68+CD206+ cells per high power field of the AVF wall, n=4–6, p=0.2407 (t-test); bar graph shows CD68+iNOS+ cells per high power field of the AVF wall, n=4–6, p=0.0819 (t-test). Conducted in male mice.
Figure 8.
Figure 8.. Bone marrow-derived macrophages from Tnc−/− mice exhibit a larger subset of Anti-Inflammatory macrophages compared to WT mice.
A. Flow cytometry analysis to characterize macrophage subsets in BMDM. Bar graph shows percentage of CD11c+CD206- cells, n=3, (ANOVA); CD11c-CD206+ cells, n=3, (ANOVA) of total CD11b+F4/80+ cells in BMDM cultured for 1, 3, and 7 days. B. qPCR analysis of BMDM for pro-inflammatory markers and F3. Bar graph shows relative number of Tnfα, n=3, (ANOVA); Il1β, n=3, (ANOVA); F3, n=3, (ANOVA) mRNA transcripts in BMDM cells cultured for 1, 3, and 7 days. C. qPCR analysis of BMDM for anti-inflammatory markers and Irf4 transcription factor. Bar graph shows relative number of Il-10, n=3, (ANOVA); Arg1, n=3, (ANOVA); Irf4, n=3, (ANOVA) mRNA transcripts in BMDM cells cultured for 1, 3, and 7 days. D. Representative Western blot of TNC, TLR4, pNF-κB, NF-κB, and F3 in BMDM cells from WT or Tnc−/− mice. E. Bar graph shows relative densitometry of TNC, n=3, (ANOVA); TLR4, n=3, p=0.9999, (ANOVA); pNF-κB:NF-κB, n=3, (ANOVA); F3, n=3, (ANOVA).
Figure 9.
Figure 9.. TnC promotes pro-inflammatory macrophage polarization through TLR4 signaling while inhibiting anti-inflammatory macrophage polarization.
A. Representative photomicrographs of iNOS (red) or CD206 (red), CD68 (green), and DAPI (blue) in THP1 cells treated with either TnC or IL-4. B. qPCR analysis of differentiated THP1 cells for pro-inflammatory markers. Bar graph shows relative number of TNFα, n=6; IL1β, n=6; IL6, n=6, (ANOVA) mRNA transcripts in THP1 cells treated for 48 hrs. C. qPCR analysis of differentiated THP1 cells for anti-inflammatory markers. Bar graph shows relative number of IL10, n=6; ARG1, n=6; IRF4, n=6; F3, n=6, (ANOVA) mRNA transcripts in THP1 cells treated for 48 hrs.

References

    1. Al-Jaishi AA, et al. , Patency rates of the arteriovenous fistula for hemodialysis: a systematic review and meta-analysis. Am J Kidney Dis, 2014. 63(3): p. 464–78. - PubMed
    1. Midwood KS and Orend G, The role of tenascin-C in tissue injury and tumorigenesis. J Cell Commun Signal, 2009. 3(3–4): p. 287–310. - PMC - PubMed
    1. Zuliani-Alvarez L, et al. , Mapping tenascin-C interaction with toll-like receptor 4 reveals a new subset of endogenous inflammatory triggers. Nat Commun, 2017. 8(1): p. 1595. - PMC - PubMed
    1. Marzeda AM and Midwood KS, Internal Affairs: Tenascin-C as a Clinically Relevant, Endogenous Driver of Innate Immunity. J Histochem Cytochem, 2018. 66(4): p. 289–304. - PMC - PubMed
    1. Song D, et al. , Activation of endothelial intrinsic NF-kappaB pathway impairs protein C anticoagulation mechanism and promotes coagulation in endotoxemic mice. Blood, 2009. 114(12): p. 2521–9. - PMC - PubMed

MeSH terms

LinkOut - more resources