

The genome of giant waterlily provides insights into the origin of angiosperms, leaf gigantism, and stamen function innovation
- PMID: 40247621
- PMCID: PMC12177460
- DOI: 10.1016/j.xplc.2025.101342
The genome of giant waterlily provides insights into the origin of angiosperms, leaf gigantism, and stamen function innovation
Abstract
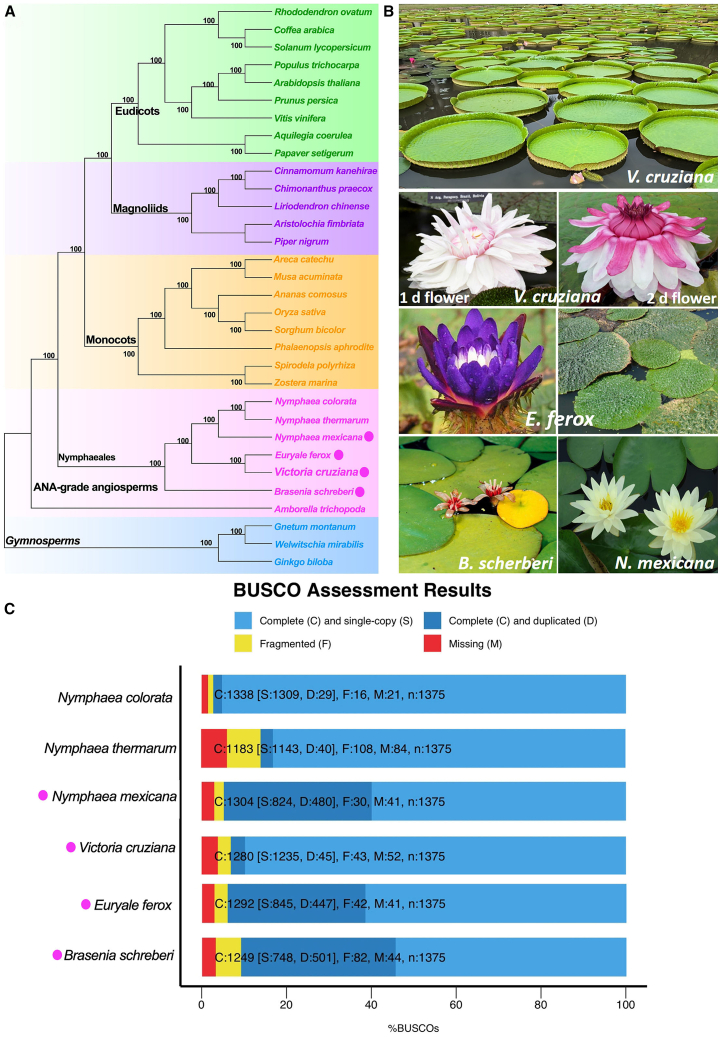
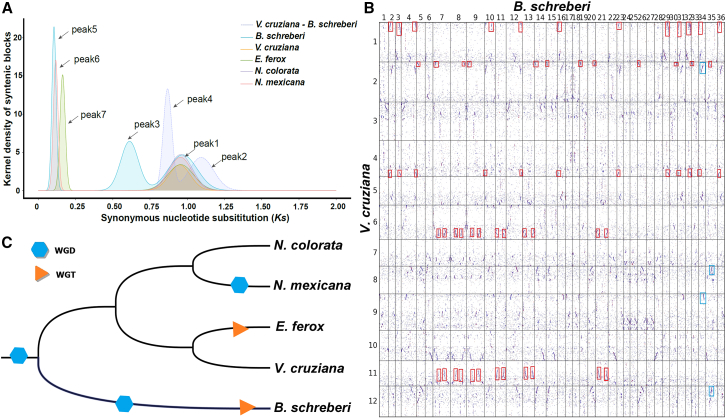
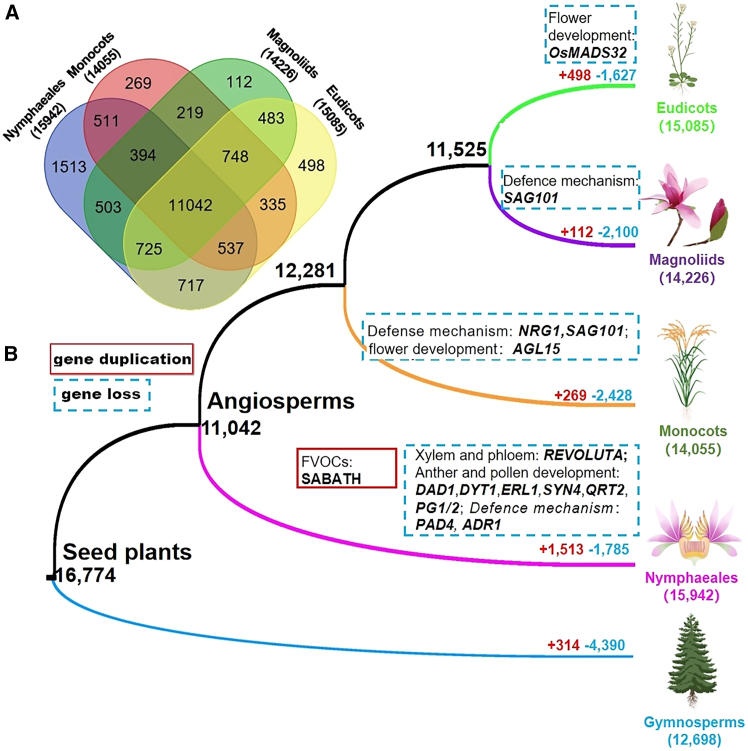
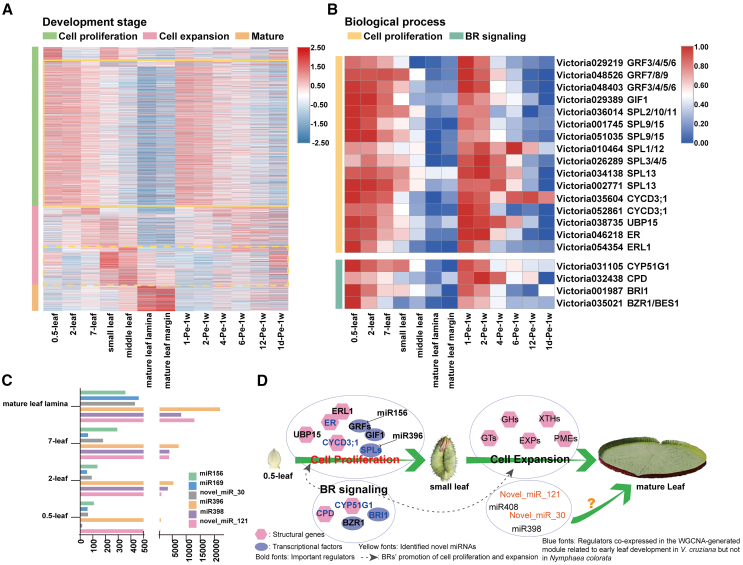
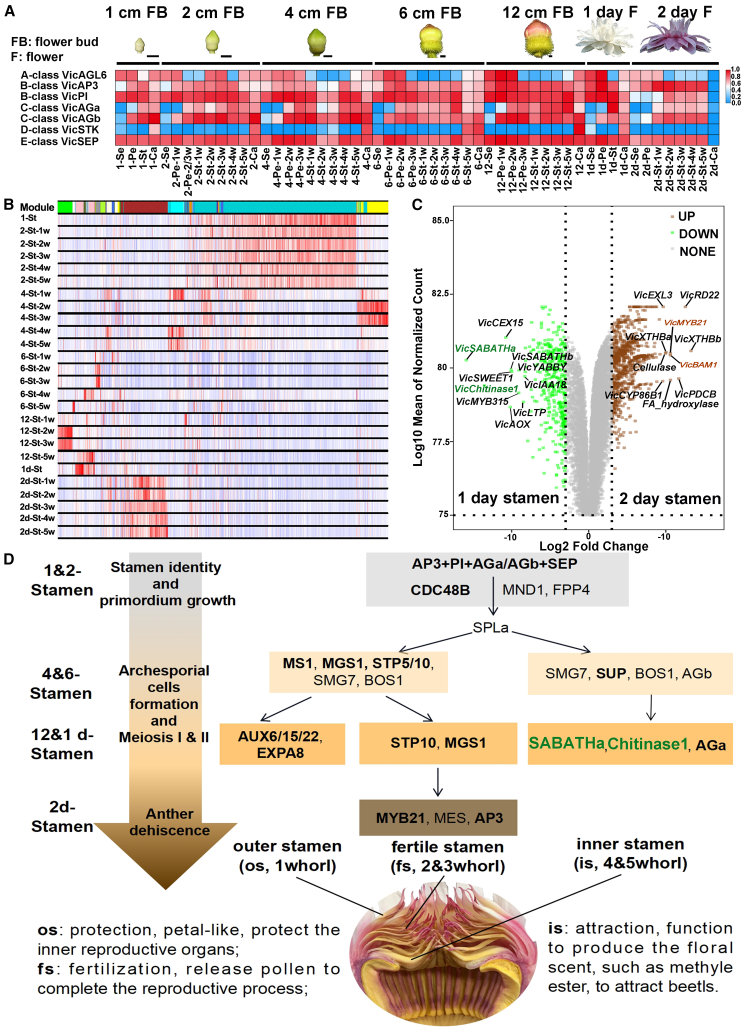
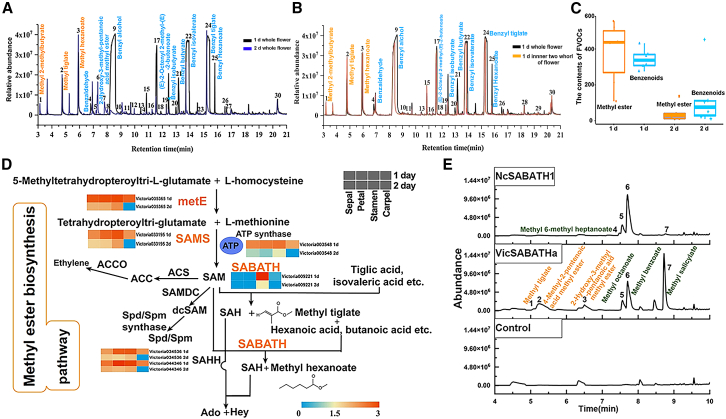
As some of the earliest evolving flowering plants, waterlilies offer unique insights into angiosperm evolution. Giant Amazonian waterlilies (genus Victoria) are of particular interest due to their production of the world's largest floating leaves and gigantic flowers that entrap pollinating beetles. Here, we report chromosome-level genome assemblies of Victoria cruziana and three related waterlilies: Euryale ferox, Nymphaea mexicana, and Brasenia schreberi. We found an ancient whole-genome duplication event specific to the Nymphaeales. We reveal major gene duplication and loss events throughout the evolution of angiosperms, with substantial implications for flower development and the biosynthesis of floral volatile organic compounds (FVOCs) in waterlilies. Importantly, we report a unique division of labor in the stamen function of V. cruziana linked to beetle attraction by FVOCs. This is related to the ultra-high expression of VicSABATHa along with Vicchitinase, possibly linked to protection from damage by trapped beetles. Overexpression of VicSABATHa in tobacco leaves reveals a capacity to produce volatile fatty acids, confirming its role in their catalytic synthesis. Overall, these findings provide novel insights into the evolution and adaptations of waterlilies and flowering plants in general.
Keywords: early angiosperms; floral scent biosynthesis; leaf gigantism; stamen innovation; waterlily genomes.
Copyright © 2025 The Author(s). Published by Elsevier Inc. All rights reserved.
Figures
Similar articles
-
Chemical, morphological, and genetic characterization of the floral scent and scent-releasing structures of Gynandropsis gynandra (Cleomaceae, Brassicales).Plant Biol (Stuttg). 2025 Aug;27(5):710-724. doi: 10.1111/plb.70011. Epub 2025 Mar 20. Plant Biol (Stuttg). 2025. PMID: 40110754 Free PMC article.
-
The expanded Bostrychia moritziana genome unveils evolution in the most diverse and complex order of red algae.Curr Biol. 2025 Jun 23;35(12):2771-2788.e8. doi: 10.1016/j.cub.2025.04.044. Epub 2025 May 8. Curr Biol. 2025. PMID: 40345196
-
The seed morphospace, a new contribution towards the multidimensional study of angiosperm sexual reproductive biology.Ann Bot. 2024 Nov 13;134(5):701-710. doi: 10.1093/aob/mcae099. Ann Bot. 2024. PMID: 38908008 Free PMC article.
-
Assessing the comparative effects of interventions in COPD: a tutorial on network meta-analysis for clinicians.Respir Res. 2024 Dec 21;25(1):438. doi: 10.1186/s12931-024-03056-x. Respir Res. 2024. PMID: 39709425 Free PMC article. Review.
-
Pharmacological and electronic cigarette interventions for smoking cessation in adults: component network meta-analyses.Cochrane Database Syst Rev. 2023 Sep 12;9(9):CD015226. doi: 10.1002/14651858.CD015226.pub2. Cochrane Database Syst Rev. 2023. PMID: 37696529 Free PMC article.
References
-
- Albalat R., Cañestro C. Evolution by gene loss. Nat. Rev. Genet. 2016;17:379–391. - PubMed
-
- Alemán-Báez J., Acevedo-Zamora J.F., Bucher J., Cai C., Voorrips R.E., Bonnema G. Expression changes of miRNA-regulated genes associated with the formation of the leafy head in cabbage. Hortic. Plant J. 2024;10:1007–1019.
MeSH terms
Substances
LinkOut - more resources
Full Text Sources
Research Materials
